The Wireshark traffic monitoring program will be a real boon for a person who understands network protocols and wants to learn more about the actions within his network. home network. It's no secret that some programs that are not even considered malicious can simply steal Internet traffic. This is where delays and low Internet speeds occur. If your speed suddenly drops, then it makes sense to try the Wireshark program, but without the slightest knowledge of network protocols it will be difficult to do this. Learn more about how to use Wireshark and what it does in this article.
Where and how to download Wireshark
Wireshark is free software and is distributed absolutely free of charge. On the official website of the developer https://www.wireshark.org you can not only download the utility, but also voluntarily donate funds for the development of the project.
- The site interface is quite simple: first click on the “Download” button.
- Then select your system type: Windows or MacOS, 32-bit or 64. The download of your version will begin immediately. If you are unsure about your system, take a closer look in the System settings in Control Panel.


- Installing the program is easy, you just need to click on the “Next” button and sometimes follow the instructions on the screen, however, some points require clarification.
- When you are asked to select a utility installation kit, check all the boxes. This way you can use the full set of Wireshark tools.

- In this window, you must configure the settings yourself according to your preferences. This indicates the creation of a shortcut, a button in the Start menu, and an association of file types. If you are not sure of your decision, then it is better to transfer all the checkmarks from the screenshot to your window.


How to enable traffic monitoring in Wireshark
Once your computer has restarted after installing the program, it is ready to use. At the same time, the Wireshark program will recommend that you install a special driver that is needed for the software to work.
- In the center of the window you will see a “Refresh interfaces” or “No interfaces found” button. Click on it to load the interfaces. You can be connected via a router, directly to a cable, over Wi-Fi networks, or through an LTE modem.
- If you have wireless connection Wi Fi, go to the “Wireless” tab.


- Click “WLAN Traffic”.


- If the connection is via a modem, pay attention to the “Telephony” tab, click the “LTE” line.


- Whatever you choose, the traffic will appear in front of you something like this. At the top, in the “Filter” line, you can enter a filter to filter out information you do not need and see network protocols only by a certain criterion.
- By clicking on one of them, you will see more information in the lower window. The main criterion can be a line with the host: the site that accepted or sent the request. Such data is indicated after the words “Host”, as well as “Accept”.
- As stated earlier, working with protocols without the slightest understanding of how they work is almost impossible. You will not understand which package went when and where. However, if this topic is even a little familiar to you, everything becomes intuitive.


How to enable Wireshark interfaces if they are not available
When you start the program, you may see a message like this. This means that the program does not see any of your connections: neither via cable nor via wireless connection.
The first thing to do is restart your computer. The program begins to function only after a restart.
The second possible and most common reason is that you have not downloaded WinPcap. These are free Windows libraries that Wireshark needs. Download them from the Internet, restart your computer and try again.
Below the article you will find a lengthy video that will tell you about a deeper interface of the program.


Wireshark: how to use?
Hello, friends! In this article I will try to explain and talk about the most important things you need to know when using Wireshark on Linux, and will show an analysis of three types of network traffic. This manual is also applicable for using Wireshark under Windows.
If you are new to information security, and you understand very well what a sniffer (traffic analyzer) is, I advise you to read the article, and only then read this article about how to use Wireshark.
Very popular and extremely skillful analyzer network protocol , which was developed by Gerald Combs, Wireshark began in June 2006 when Combs renamed the networking tool he had also created, Ethereal, because he had changed jobs and could no longer use the old name. Today, most people use Wireshark, and Ethereal is history.
Wireshark: the best sniffer
You might be wondering how Wireshark is different from other network analyzers - other than the fact that it's free - and why don't we just start promoting the use of tcpdump for packet capture?
The main advantage of Wireshark is that it is a graphical application. Collecting data and checking network traffic in the user interface is a very convenient thing, as it allows you to understand complex network data.
How to use Wireshark?
For a beginner to understand Wireshark, they need to understand network traffic. If so, the purpose of this article is to explain the basics of TCP/IP to you so that you can draw the necessary conclusions from the network traffic you analyze.
 TCP packet and IP packet format.
 If you run Wireshark as a standard user, you will not be able to use network interfaces to collect data due to the default Unix file permissions on network interfaces. It is more convenient to run Wireshark as root (sudo wireshark) when collecting data and as a regular user to analyze data.
Alternatively, you can collect network data using the utility command line tcpdump as root and then analyze them using Wireshark. Please remember that collecting data using Wireshark on a busy network may slow down your computer, or worse, prevent you from collecting the data you need because Wireshark requires more system resources than a command line program. In such cases, the most reasonable solution for collecting network traffic data is to use tcpdump.
Capture network data using Wireshark
The easiest way to start capturing network packet data is to select the interface you need after launching Wireshark and click on Start. Wireshark will show network data on your screen based on your network traffic. Please note that you can select more than one interface. If you don't know anything about TCP, IP, or other protocols, you may find the result difficult to read and understand.
To stop the data capture process, select Capture > Stop from the menu. Alternatively, you can click on the fourth icon from the left, the one with the red square (it's short for Stop Capturing live data") in the Main toolbar (note that its exact location depends on the Wireshark versions). This button can only be pressed while network data is being collected.
When using this capture method, you cannot change Wireshark's default Capture Options. You can see and change Capture Options by selecting Capture > Options from the menu. Here you can select the network interface(s), view your IP address, apply data collection filters, translate your network card into the mode of receiving all network packets and saving the collected data into one or more files. You can even tell it to stop capturing packets after reaching a certain number of network packets, or a certain time, or a certain amount of data (in bytes).
By default, Wireshark does not save collected data, but you can always save it later. It is generally believed that it is best to save and then examine network packets, unless you have some special reason to do otherwise.
Wireshark allows you to read and analyze already collected network data from a large number of file formats, including tcpdump, libpcap, snoop from Sun, nettl from HP, K12 text files, etc. In short, Wireshark can read almost any format of collected network data. Similarly, Wireshark allows you to save collected data in different formats. You can even use Wireshark to convert a file from one format to another.
You can also export existing file in the form of a simple text file from the File menu. This option is mainly intended for manually processing network data or entering it into another program.
There is an option to print your packages. I've never used it in real life, but for educational purposes it can be very helpful to print out the packages and their full contents.
Wireshark Display Filters
If capture filters are applied when capturing network data, Wireshark does not take into account network traffic that does not match the filter; whereas display filters are applied after data is captured and “hide” network traffic without deleting it. You can always disable the Display filter and get your hidden data back.
In principle, display filters are considered more useful and versatile than data collection filters because you are unlikely to know in advance what information you will collect or decide to examine. However, using filters when capturing data saves you time and disk space, which is the main reason for using them.
Wireshark highlights a syntactically correct filter with a light green background. If the syntax contains errors, the background turns pink.
Display filters support comparison operators and logical operators. Display filter http.response.code
 Three packets (SYN, SYN+ACK and ACK) of three-step TCP connection setup
 404 && ip.addr == 192.168.1.1 shows traffic that either comes from IP address 192.168.1.1 or goes to IP address 192.168.1.1, which also has a 404 response code ( Not Found) HTTP. The!boo1p &&!ip &&!agr filter excludes BOOTP, IP and ARP traffic from the result. Filter eth.addr == 01:23:45:67:89:ab && tcp.port == 25 displays traffic coming from or to network device with MAC address 01:23:45:67:89:ab, which uses TCP port number 25 for incoming and outgoing connections.
Remember that display filters don't magically solve problems. When used correctly, these are extremely useful tools, but you still have to interpret the results, find the problem, and figure out the appropriate solution yourself.
Article continues on next page. To go to the next page, click on button 2 which is located under the social network buttons.
On this page you will find answers to the most popular questions about the WireShark sniffer:
⦁ where to download WireShark for free;
⦁ why you shouldn’t download Wireshark from torrents;
⦁ where to get WireShark in Russian (russifier);
⦁ where to get instructions for WireShark in Russian,
⦁ guide to working with WireShark.
Wireshark is a very powerful and one of the world's best sniffer for capturing and decoding network traffic. Provides the ability to decode over 500 different data network and telecommunications protocols, including cellular communications. It is the de facto (and often de jure) standard in many industries and educational institutions around the world. Many commercial product manufacturers use it as a decoder in their solutions.
The WireShark program is completely free and has been constantly improved by several authors with donations from sponsors since 1998.
Where can I download WireShark for free?

Download the program only from this page!
Where can I download WireShark in Russian?
WireShark is developed by an international team of fans and, unfortunately, is only available on English language. It is useless to look for a crack or a version in Russian.
Where can I get instructions for working with WireShark?

If you want to explore all the features and become a professional WireShark user, there are two ways to do this.
⦁ Method one.
Trial and error method. Capture traffic, try to analyze it, communicate with colleagues on various forums and groups. For example, here: https://ask.wireshark.org/
⦁ Method two.
You can complete official courses and receive a user or instructor certificate. You can prepare for the courses by mastering this guide: http://www.wiresharkbook.com/epg.html
This book is the perfect resource for exam preparation!
User guide

The official Wireshark sniffer user manual is available in English (there is no Russian) in various versions:
⦁ online manual: https://www.wireshark.org/docs/wsug_html_chunked
⦁ download the manual in the archive.
Wireshark is a powerful network analyzer that can be used to analyze the traffic passing through your computer's network interface. This may be needed to detect and solve network problems, debug your web applications, network programs or sites. Wireshark allows you to fully view the contents of a packet at all levels, so you can better understand how the network works at a low level.
All packets are captured in real time and provided in an easy-to-read format. The program supports very powerful system filtering, color highlighting, and other features that will help you find the packages you need. In this tutorial we will look at how to use Wireshark to analyze traffic. Recently, the developers began working on the second branch of Wireshark 2.0, which introduced many changes and improvements, especially to the interface. This is what we will use in this article.
Key Features of Wireshark
Before moving on to considering ways to analyze traffic, you need to consider what features the program supports in more detail, what protocols it can work with and what to do. Here are the main features of the program:
- Capture packets in real time from wired or any other type of network interfaces, as well as read from a file;
- The following capture interfaces are supported: Ethernet, IEEE 802.11, PPP, and local virtual interfaces;
- Packets can be filtered out based on many parameters using filters;
- All known protocols are highlighted in the list in different colors, for example TCP, HTTP, FTP, DNS, ICMP and so on;
- Support for capturing VoIP call traffic;
- Decryption of HTTPS traffic is supported if a certificate is available;
- Decryption of WEP, WPA traffic wireless networks with a key and handshake;
- Displaying network load statistics;
- View package contents for all network layers;
- Displays the time of sending and receiving packages.
The program has many other features, but these were the main ones that might interest you.
How to use Wireshark
I assume that you already have the program installed, but if not, you can install it from the official repositories. To do this, type the command in Ubuntu:
$ sudo apt install wireshark
After installation, you can find the program in the main menu of the distribution. You need to run Wireshark with superuser rights, because otherwise the program will not be able to analyze network packets. This can be done from the main menu or through the terminal using the command for KDE:
$ kdesu wireshark
And for Gnome/Unity:
$gksu wireshark
The main window of the program is divided into three parts, the first column contains a list of network interfaces available for analysis, the second column contains options for opening files, and the third column contains help.
Network traffic analysis
To start analysis, select a network interface, for example, eth0 and click the button Start.

After this, the following window will open, already with a stream of packets that pass through the interface. This window is also divided into several parts:
- Top part- these are menus and panels with various buttons;
- List of packages- then the flow of network packets that you will analyze is displayed;
- Package Contents- just below is the contents of the selected package, it is divided into categories depending on the transport level;
- Real performance- at the very bottom the contents of the package are displayed in real form, as well as in HEX form.
You can click on any package to analyze its contents:

Here we see a DNS request packet to get the site’s IP address, the domain is sent in the request itself, and in the response packet we receive our question, as well as the answer.
For more convenient viewing, you can open the package in a new window by double-clicking on the entry:

Wireshark filters
It is very inconvenient to manually sort through packages to find the ones you need, especially with an active thread. Therefore, for this task it is better to use filters. There is a special line under the menu for entering filters. You can click Expression to open the filter designer, but there are a lot of them so we'll look at the most basic ones:
- ip.dst- target IP address;
- ip.src- sender's IP address;
- ip.addr- ip of the sender or recipient;
- ip.proto- protocol;
- tcp.dstport- port of destination;
- tcp.srcport- sender port;
- ip.ttl- TTL filter, determines the network distance;
- http.request_uri- the requested site address.
To specify the relationship between a field and a value in a filter, you can use the following operators:
- == - equals;
- != - not equal;
- < - less;
- > - more;
- <= - less or equal;
- >= - more or equal;
- matches- regular expression;
- contains- contains.
To combine multiple expressions you can use:
- && - both expressions must be true for the package;
- || - one of the expressions may be true.
Now let's take a closer look at several filters using examples and try to consider all the relationship signs.
First, let's filter all packets sent to 194.67.215.125 (losst.ru). Enter a string in the filter field and click Apply. For convenience, wireshark filters can be saved using the button Save:
ip.dst == 194.67.215.125

And in order to receive not only sent packets, but also those received in response from this node, you can combine two conditions:
ip.dst == 194.67.215.125 || ip.src == 194.67.215.125


We can also select transferred large files:
http.content_length > 5000
Having filtered the Content-Type, we can select all the pictures that were downloaded, we will analyze the wireshark traffic, packets that contain the word image:
http.content_type contains image
To clear the filter you can press the button Clear. It happens that you don’t always know all the information necessary for filtering, but just want to explore the network. You can add any field of a package as a column and view its contents in the general window for each package.
For example, I want to display the TTL (time to live) of a packet as a column. To do this, open the package information, find this field in the IP section. Then call context menu and select the option Apply As Column:


You can also create a filter yourself based on any desired field. Select the desired field and call the context menu, then click Apply as filter or Prepare as filter, then select Selected to display only the selected values or Not selected to remove them:

The specified field and its value will be applied or, in the second case, inserted into the filter field:

In this way, you can add a field of any package or column to the filter. There is also this option in the context menu. To filter protocols, you can use simpler conditions. For example, let's analyze Wireshark traffic for the HTTP and DNS protocols:
Another interesting feature of the program is the use of Wireshark to track a specific session between the user's computer and the server. To do this, open the context menu for the package and select Follow TCP stream.
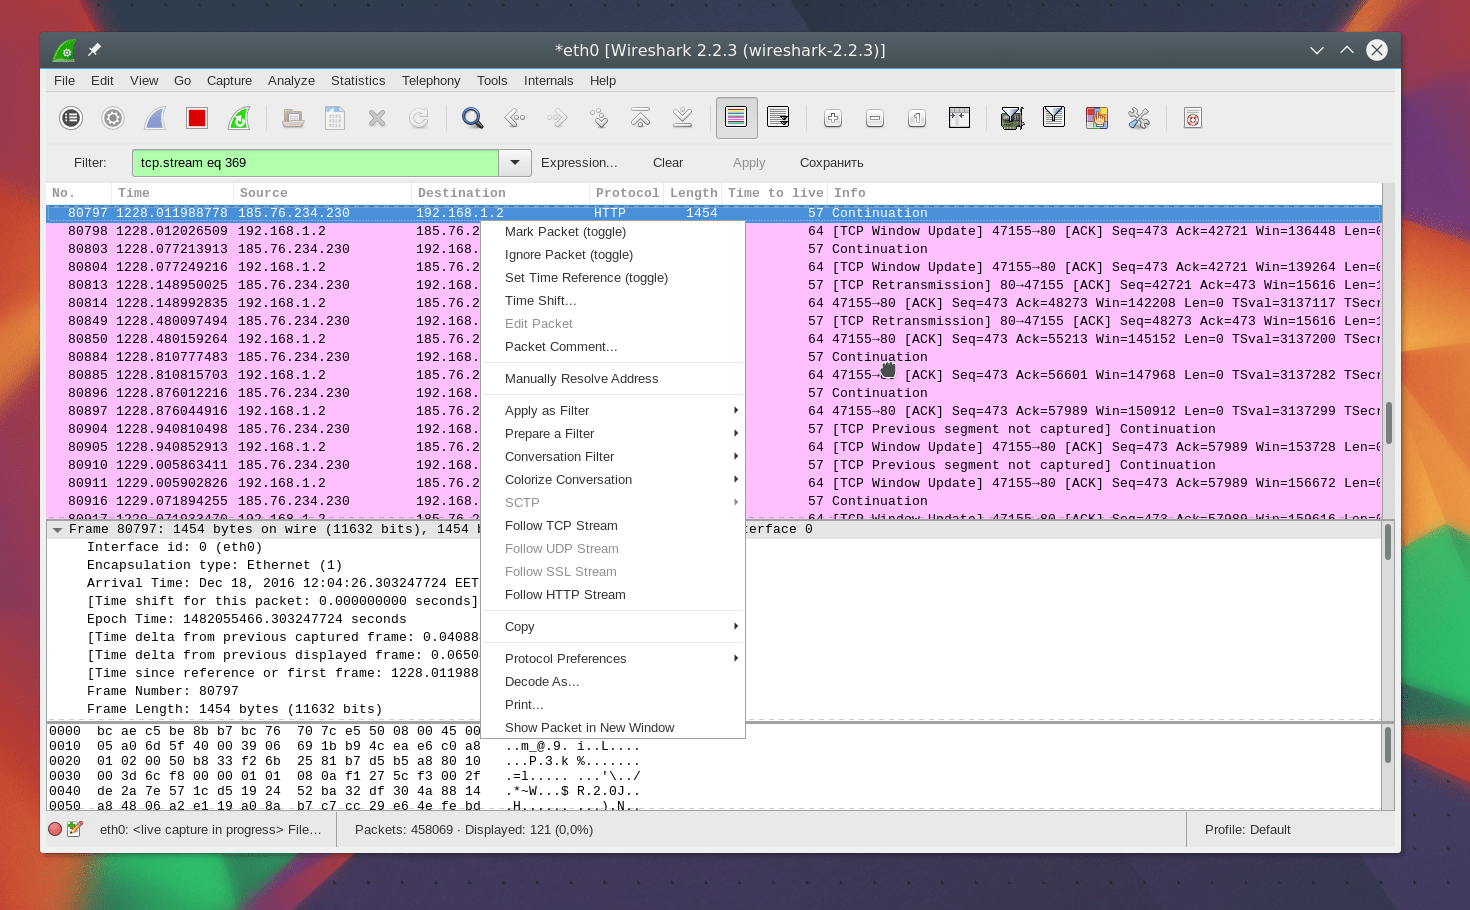
Then a window will open in which you will find all the data transferred between the server and the client:

Diagnosing Wireshark problems
You may be wondering how to use Wireshark 2 to detect network problems. To do this, there is a round button in the lower left corner of the window; when you click on it, a window opens Expet Tools. In it, Wireshark collects all error messages and problems on the network:

The window is divided into tabs such as Errors, Warnings, Notices, Chats. The program can filter and find many network problems and here you can see them very quickly. Wireshark filters are also supported here.

Wireshark traffic analysis
You can very easily understand what exactly users downloaded and what files they viewed if the connection was not encrypted. The program does a very good job of extracting content.
To do this, you first need to stop traffic capture using the red square on the panel. Then open the menu File -> Export Objects -> HTTP:


This is very powerful utility, which has a lot of functions. It is impossible to put all its functionality in one article, but the basic information provided here will be enough for you to master everything you need yourself.