Creating reports is one of the main functions of any accounting system. What types of reports exist in 1C Accounting 3.0, how reports are configured in 1C Accounting 8.3 and what tools exist for creating new reports - we will look at today.
Types of standard reports
The company's 1C accounting program is initially pre-installed with a wide range of reports that allow you to receive all necessary information. Their full list is presented in the “Reports/Standard Reports” section:
Also, each section of the program presents other types of standard reports, for example, salary reports in 1C 8.3 are stored in the “Salaries and Personnel/Salary Reports” section.
In each report, there is the possibility of “additional customization” of the report, namely, you can add or remove some additional fields, add grouping, selection, etc.
Let's consider the setup option using the example of adding an additional field to the standard report “Account balance sheet” (select account 10). To do this, go from the “Show settings” button to “ Additional fields", add a new field, and in the selection form go to the field we need, for example, to reflect the article number of an item in the report, select the “Article number” field, which is located inside the “Nomenclature” field (to expand the field you need to click “+”):

After clicking “Generate”, the additional field we selected appears.
As an example, consider a situation where the report requires including the entire list of items containing the word “boot” in the name. What do I need to do? By clicking “Show settings”, go to the “Selection” tab, add a new field, and in the window that appears, opening the “+” field “Nomenclature”, select “Name”.

After generating the report, we receive a nomenclature that contains only the value we specified in the name.
Generating reports by document
In the “Standard reports” section there is a universal report that allows you to display information from such configuration objects as:
- Document;
- Directory;
- Accumulation register;
- Register of information;
- Calculation register.
Let's look at examples of situations where a report will help the user not to resort to developing external reports, but to use a standard settings mechanism.
For example, we need to generate a report that will reflect all goods received from a specific counterparty for a certain period. To do this, in the report header, select from the drop-down list the type of object – “Document”, the type of object – “Receipt (acts, invoices)”, and indicate the type – “Goods”.
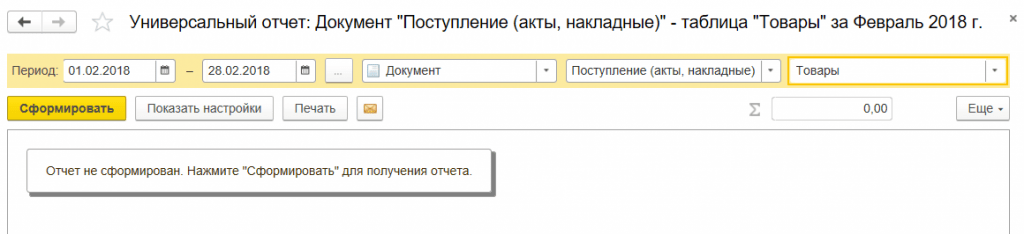
*The Counterparty field is not there initially.
In the “Type of comparison” field set “Equal”, in “Value” select the desired counterparty from the directory.

At the top of the report, indicate the required period and generate the report.

You can save the settings we have made: to do this, click the “More/Save” button.
Let's consider a situation where, in order to correctly generate regulated reporting, it is necessary to check all movements in the “Separate VAT accounting” register by document.
To do this, in the report header, select the object type from the drop-down list - “Accumulation Register”, in the next field select the object type - “Separate VAT accounting”, in the last field select the type - “Balances and turnover”.
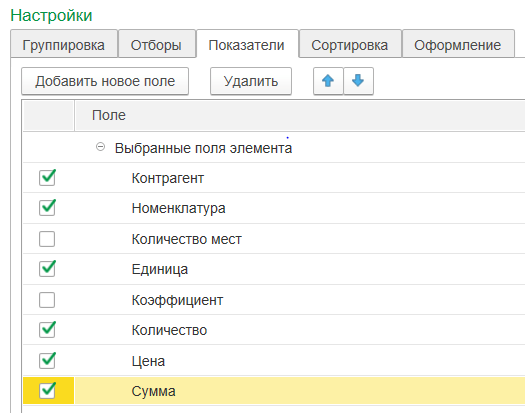
In order for the report to display information in the context of documents, click the “Show settings” button to go to the report settings, then to the “Indicators” tab, add a new field and in the window that appears, select the “Registrar” field (“registrar” is the document that contains a movement was formed along the accumulation register). The newly added field is reflected at the bottom of the list of fields by default: using the “blue arrows” we move the “Registrar” field to top part list.

In this article, we looked at what options exist for working with reporting in 1C Accounting 8, how to use the report settings and what information can be obtained using a universal report.
They say that the name 1C originally meant the phrase “one second”, i.e. programs must produce reports quickly, “in one second.” The speed of the reports is very important, but it is even more important that the reports provide the correct information - we will understand this using the example of creating a simple report in 1C 8.3 based on the Trade Management 10.3 configuration. To create correct reports, it is desirable (even strongly recommended) to be able to configure 1C and to be able to program a little in the internal language and query language of 1C, although, on the other hand, creating reports is an excellent opportunity to start mastering these skills.
This description is educational for understanding the basic principles of creating 1C reports
How to create a report in 1C 8.3
To create a report, you need to open 1C in configurator mode; to do this, in the 1C launch window, select the necessary base in the list and click the Configurator button:
In the configurator itself, go to the File menu and select New:

In the menu that appears, select External report and click OK:

After this, a new report window will open. In the Name field, enter the name of the report; it must be without spaces or special characters:

How to make a report using a layout
This method most requires programming skills in 1C, but here we will not analyze the mechanisms for receiving and processing data, we will make a simple report to understand the mechanism for launching the report and displaying the report form on the screen:
In the report window (which opens when creating a report), in the lower list, place the cursor on the Layouts item and, when clicking right click mouse, in the menu that appears, click Add:

In the layout designer that opens, you can specify the name of the layout, Spreadsheet Document should be selected as the layout type, and then click the Finish button in the designer:

This will open a layout window resembling an Excel sheet:

In this layout, you need to create areas - groups of rows or columns that the program will use as templates, insert data received from the database into them and display these templates on the screen, thereby putting together a report from these parts.
Let's create a report that displays a list of items. To do this, we will create two layout areas: the report header and the item line.
To create a header area, left-click on the line header (where the line number is indicated) to select the line like this (the entire line should be selected with one click on the header):

After that, go to the Table menu of the main menu, go to the Names submenu and click on the Assign name item:

The program will prompt you to specify the Area Name, the name should also not contain spaces or special characters, after that click OK, it should look like this:

Now in the created area you need to enter the text that will be displayed in the report and format it. To do this, enter text in the first cell, for example, “List of items.” Working with cells is similar to Excel.
To format text in a cell, right-click on the cell and click on Properties. The cell properties window will open on the right. Scrolling down the contents of the window, find the Font field and click on the “...” button:

In the window that opens, in the Style section, check the Bold box and click OK:

The layout should look like this:

In the same way, we create the item line area, but do not highlight it in bold:

In the line area you need to indicate that Name is a parameter, i.e. that the real name of the item will be substituted there when outputting the report. To do this, open the properties of the cell with the name and in the properties in the Filling field, select the value Option, this completes the layout setup:

We return to the main report window and in the lower list, right-click on the Forms item and click Add:

In the report form designer that opens, click the Finish button, the report form will open, double-click on the Generate button:

As a result, the button properties window will open on the right side of the screen; in the Action field, click on the magnifying glass:

After this, a form module will open in which you need to program the generation of a report:

First, replace the selected text with the following program code:
//create a spreadsheet document that will be filled with parts of the report and displayed on the screen
TabDocument = New TabularDocument;
//next, we get the layout that was created when creating the report
Layout = GetLayout("Layout");
//now we need to display the report header, for this we get the header area from the layout and display it in a spreadsheet document
AreaHeader = Layout.GetArea("Header");
TabDocument.Output(AreaHeader);
//using a query we get a selection of item names that need to be displayed in the report
Request = New Request;
Request.Text = "
|SELECT
| Name
|FROM
| Directory.Nomenclature
|";
//get the item line area from the layout - we will access it in a loop to display each item
AreaString = Layout.GetArea("String");
//process each name from the resulting selection in a loop
Select = Query.Run().Select();
While Select.Next() Loop
//to display the next line, you need to specify the next name in the area parameter (we configured the parameter itself when creating the layout)
AreaString.Parameters.Name = Selection.Name;
//the parameter has been filled in, now you can display the string
TabDocument.Output(AreaString);
EndCycle;
//the spreadsheet document has been generated, now we display it on the screen
TabDocument.Show("List of items");
When the text is copied into the form module, lines starting with a double slash “//” will be highlighted in green - these are comments that describe what each line of code does:

Let's summarize what lines of program code are needed to generate a report:
- It is necessary to create a spreadsheet document that will be filled with parts of the report and displayed on the screen; this is done with the line “TabDocument = New TabularDocument;”
- We need to get the report layout, from it we will get the report structure in parts (areas), this is done with the line “Layout = GetLayout(“Layout”)”
- To display each of the areas, you need to get it from the layout and output it to a spreadsheet document, this is done with the lines "Header Area = Layout.GetArea("Header")" and "TabDocument.Output(HeaderArea)"
- If you need to fill in parameters that become known only when the program is executed, then before displaying the area you need to fill in such parameters, this is done with the line “AreaString.Parameters.Name = Selection.Name”
- And only when the spreadsheet document is filled with all the necessary parts of the report, it is displayed on the screen, this is done with the line “TabDocument.Show(“List of items”)”
And now you can check the operation of the report - open 1C in enterprise mode (button 1C: Enterprise in the 1C launch window). In the main menu, go to the file menu, click Open:

Find and open the saved report file. In the form that opens, click the Generate button:

and we get a list of nomenclature:

This is just one way to create reports in 1C. In the following articles we will look at others.
IN top menu let's go to Service->->.
After this, the directory list form will appear. In the top menu click Add.
The window for adding a new report appears. Press the button Open.

Select the file with the desired report and click Open. After adding the file, if necessary, change the name of the report (how it will be displayed in the list). Click OK.

As a result, the new report appears in the list.

After this, the report can be used, adding is completed. To open this report later, we also go to Service->Additional reports and processing->Additional external reports.
For BP 3.0, ZUP 3.0, UT 11, ERP 2.0.
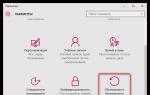
To add external report in 1C:Enterprise 8.3 configurations managed interface(using Accounting 3.0 as an example) let’s enter the corresponding section of the program:

It is necessary that the option to use additional reports is enabled, follow the hyperlink:
In the list that opens, click the button Create:

After this, a file selection dialog box with a report will immediately open, in which you need to select required file(in my case this is a file with a plan-actual cost analysis).
Now you need to configure accommodation(the place in the program where the report will be available):

Randomly select the desired section of the program from the list:

Now you need to record the changes in the external report card:
Now open the report from the program interface:

The list is still empty, click Customize the list:

In the selection form, tick our report:

Now it appears in the list:

By button Execute The report form opens:

Login to the site as a student
Data composition system 1C 8.3 for beginners: first report on SKD
If you have not read the introduction to this module, please read it: .
To complete the lessons you will need 1C 8.3 (not lower 8.3.13.1644 ) .
If you already have 1C version 8.3 installed, use it. If not, download and install educational version, which 1C produces specifically for educational purposes:.
The following shortcut should appear on your desktop:
For all the lessons in this series we will use the Gastronom database I prepared. It completely coincides with the base that we used in the school modules when studying queries. Therefore, I expect you to be familiar with its reference books and documents.
If you deleted it, download it again using the following one, unpack it and add it to the list of databases.
Finally, the workbench is set up and now we will create our first report together using the data composition system. It will be very simple to demonstrate the general capabilities of a data composition system (abbreviated SKD).
Setting a goal
Purpose of this lesson- create a report that, in user mode, displays a list of clients with the following fields:
- Name
- Floor
- Client's favorite color.
The report must be external. This means that it will be created and configured in the configurator, and then saved as a separate (external) file on the computer.
To generate such a report in 1C, the user will need to launch the database in user mode, open this file and click the “Generate” button.
Go!
Creating a report
We launch the configurator for the Gastronom database:

From the main menu, select "File" -> "New...":

Select "External report":

Creating a data layout diagram inside the report
The window for creating an external report opens. For the name, enter: " Lesson 1", and then press the button " Open data composition diagram":

The schema creation designer has started. We agree with the default name " MainData Layout Schema" and press the button " Ready":

The main one has opened working window, with many bookmarks and fields, in which we will configure our data layout scheme.
There is no need to be scared - there are really a lot of opportunities here, but we don’t need all of them. Especially in the first lesson.

Now we are on the bookmark " Datasets"We'll stay there."
We write a request through the constructor
The data composition system (abbreviated as DCS) requires us to data, which it will display to the user.
The easiest way - write a request to the base. In school we learned to write and understand requests - so I expect you to have the appropriate skills.
Click on green plus sign and in the drop-down list select the item " Add Dataset - Query":


Our task is to write the request text in this field. Have you forgotten how to do this yet?
I'll give you a hint:
In this query we have selected three fields (" Name", "Floor" And " Favorite color") from table " Directory.Clients".
But don’t rush to write this text in the “Request” field manually.
Now we will create the same request visually, only using the mouse. This method is called " Query constructor".
To call this constructor, click the button " Query constructor..." in the upper right part of the "Request" field:

In the window that opens, drag the table " Clients" from the first column to the second to indicate that it is from this table that we will query the data:

It turned out like this:

Next, we will open the table " Clients"in the second column by sign" Plus"to see all its fields and drag the field" Name" from the second column to the third to indicate that from this table we need to query the "Name" field:

It turned out like this:

Let's do the same with the fields" Floor" And " Favorite color". The result will be like this:

Click the "OK" button to exit the query builder and see that the query text is automatically added to the "Query" field.
Moreover, based on the text of the request, 1C itself pulled out the names of the fields (the area above the request) that will be used by the data composition scheme:

Now that we have compiled a request, the ACS knows how to obtain data for the report.
Setting up data presentation
It remains somehow visualize this data for the user in the form of a printed form. And this is where ACS can work wonders!
To create such a miracle, let's go to the tab " Settings" and click the settings designer button ( Magic wand):

In the window that opens, specify the report type " List" and press " Further":

In the next window, select (by dragging) the fields that need to be displayed in the list (drag all of those available to us: " Favorite color", "Name" And " Floor"):

Let's get this result and press the button " OK":

The settings designer closed and the item " Detailed entries":

The report is ready, let's check it. To do this, first save the report as external file.
Save the report as a file
Open the main menu item " File"->"Save":

I'll save it to my desktop under the name " Lesson 1":

Checking the report in user mode
Finally, let’s close the configurator and go to our database in user mode:

Username "Administrator", no password:

Through the menu, select the item " File"->"Open...":

And specify the report file (I saved it to the desktop under the name “Lesson1.erf”:

The report form has opened, click the button " Form":

Ready! Here she is ours printed form with a list of clients, their favorite color and gender:

The printable form can be easily printed. To do this, just select the item " File"->"Seal...":

So simply, without programming, we managed to create a full-fledged report that users can open in their databases, generate and print.
students - I answer by mail, but first look at.
Login to the site as a student
Log in as a student to access school materials