Probably, not a single serious configuration on 1C 8.3 or 8.2 can do without the use of routine and background tasks. They are very convenient, since they will be executed according to a clearly defined schedule without user or programmer intervention.
For example, you need to exchange data with another program once a day. Using routine and background tasks, 1C will be able to perform these actions independently, for example, during non-working hours. This method will not affect the user experience in any way and will help save time.
First, let's figure out what they mean and what is their difference:
- Scheduled task allows you to launch any specific actions according to a pre-configured schedule.
- Background job is an object that contains the actions to be performed.
Let's assume that our company sells something and has its own website on which prices are located. We want to upload them once a day to maintain relevance.
Open the configuration and add a scheduled task.
Setting properties
Let's look at the most important parameters that need to be filled in its properties.

- In field " Method name» a certain procedure is selected common module, which will be directly executed. It will indicate all the steps for uploading prices to our website. Please note that execution will take place on the server. This is logical, because routine operations are performed without user participation.
- The scheduled task can be disabled or enabled as needed. There is no need to edit his schedule every time. To do this, in the properties palette, set or clear the flag " Usage».
- Another important thing is to set whether this routine task will be predetermined, or not. Predefined scheduled tasks are launched automatically. If this feature is not installed, then you will need to launch them programmatically, or use the “Task Console” processing with ITS.
- You can also specify number of repetitions and interval between them in case of abnormal termination. Abnormal termination refers to those situations when jobs were not completed due to an error.
Setting up a schedule
The final step is to set up a schedule for our upload to the site using the corresponding hyperlink in the properties palette.

It will open before you typical setting schedules in 1C 8.3. There is nothing complicated here. Within this example We have set up the launch of our uploading of prices to the site daily from five to seven in the morning. In the event that the scheduled task does not have time to be completed before 7:00, it will be completed the very next day.

Blocking scheduled tasks
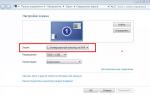
Run the standard utility “Administering 1C Enterprise Servers” and open the properties of the infobase where you created the routine task (for client-server versions of 1C).

In the window that opens (after entering your login and password to access the information security), check that the checkbox “Blocking of routine tasks is enabled” is not selected. If you encounter a situation where the task does not work, check this setting first.

In the same way, you can completely disable routine tasks in 1C 8.3. To disable specific background jobs, you can use the “Background Job Console” processing built into the latest releases.
Background and scheduled tasks in file mode
IN this mode Setting up and running these jobs is much more difficult to organize. Most often, additional Account, whose session will always be open.
In this case, routine tasks are activated using the “RunTaskProcessing()” method.
You can also use the following construction:
As the procedure name, you must specify the name of the client procedure that will be executed. The interval shows how many seconds later the execution will take place. The “One time” parameter is not required. It reflects whether this procedure will be performed once or several times.
Tracking errors in background jobs
View the progress of background tasks, as well as the availability possible errors can be found in the log book. In the filter, select the “Background job” application and, if necessary, select the importance of interest, for example, only “Errors”.

The log will show all entries that match your selection, along with a comment that will help you understand the reason for the error.
Sometimes there is a need to debug a background (routine) job. This is precisely where the problem often arises.
Sometimes there is a need to debug a background (routine) job. This is precisely where the problem often arises. And this problem is that the debugger cannot connect to the process running on the server side.
To solve this problem we need to solve two problems:
1. Enable debugging on the 1C server. By default, debugging on the server is disabled and to enable it, you must: Run Windows registry, writing in " Execute" command REGEDIT. Find line
"C:\Program Files\1cv81\bin\ragent.exe" -srvc -agent
(taken from the startup parameters of the 1C:Enterprise 8.1 Server Agent service). (this is for platform version 8.1)
Add the key to the end -debug (Don’t forget to put a space before the -debug key)
Example
. "ImagePath"= was "C:\Program Files\1cv81\bin\ragent.exe" -srvc -agent -regport 1541 -port 1540 -range 1560:1591 -d "C:\Program Files\1cv81\server" put "C:\Program Files\1cv81\bin\ragent.exe" -srvc -agent -regport 1541 -port 1540 -range 1560:1591 -debug-d "C:\Program Files\1cv81\server"
Restart the server agent. Ready. Now we can debug server execution threads.
2. The case of the letters of the server name and the database name in the client connection to the 1C server must match exactly.
Correct connection:Incorrect connection:
Background job Client - Srvr="SERVER-NAME";Ref="Base_Name";
Background job - Srvr="SERVER-NAME";Ref="Base_Name"; Client - Srvr="Server-name";Ref="Base_Name";
How can you find out with what parameters the background job connects to the database? You can think of different ways, one of which is to log these parameters at runtime background job.
The code is as follows:
Procedure WriteConnectionWithBase() Export
Journal EntryRegistration(,InformationBaseConnectionString());
End of Procedure
While a background job is running, a line with the database connection parameters used by the background job will be written to the log.

Now we specify automatic connection to background jobs.
After carrying out such manipulations, you can debug background jobs.
Haven't you read it yet? You might be interested...
In modern 1C:Enterprise configurations, background jobs are widely used.
In particular, in all standard configurations, many reports are generated in background, which allows you to continue working in the same 1C session during report generation without waiting for the report to complete execution. And of course there is a need debugging code while background jobs are running. To successfully start debugging background jobs, several conditions must be met.
Enable debugging mode on the 1C:Enterprise server.
The first thing you need to do is make sure that the 1C:Enterprise server is running in debug mode. If debugging is not enabled on the server, you must stop the service ragent and re-run it with the parameter /debug
Configure automatic connection of background jobs in the configurator
Since the background job does not have a client part, the configuration is performed in the configurator automatic connection to background jobs. To do this, select the item in the menu Debug -> Connection
In the dialog box that opens, click the button Automatic connection and in the next window check the box Background jobs

Correctly enter the connection string to the 1C database
Theoretically, the two points listed above should be enough to trigger breakpoints when a background job is running. But in practice, many are faced with the fact that automatic connection to background jobs does not occur. This is related to the connection string to the infobase.
The point is that the connection string to launch the configurator must exactly match the connection string of the background job. Moreover, the match must be character-by-character. Even the case of letters is taken into account. After all, when adding a base to the list information bases we can register a cluster of servers for the same database with several different ways: using an IP address, through a server name, with or without a port. And all these different connection strings can work equally well. But when debugging background jobs, problems may arise. So, for example, I was faced with the fact that in the list of databases I had a connection string using the port
Srvr="Server1C:1541";Ref="Test";
And for some reason the background task was launched without specifying the port
Srvr="Server1C";Ref="Test";
Therefore, I had to change the connection string in the list of databases accordingly.
But here a question immediately arises. How can I find out the connection string of a background job? This is where . After all, while a background job is running, we can programmatically make entries in the log. And using the procedure InformationBaseConnectionString() we can get the connection string.
Thus, we do it in a suitable general module (for me it will be BackgroundTasksServer) here is the procedure
Procedure LogConnectionString() ExportConnectionString = InformationBaseConnectionString() ; LogRegistration(ConnectionString) ; End of ProcedureNow let’s execute this procedure by running:
&OnServer Procedure WriteConnectionStringOnServer() BackgroundTasks. Run ( "BackgroundTasksServer.WriteConnectionStringToLog") ; End of ProcedureWe open the registration log, look at the entry with the connection string, and register the settings for connecting to the database by analogy with the background job.
Debugging 1C- a very powerful and functional mechanism of the 1C 8.3 platform, which allows you to quickly find errors in the program code (in other programming languages this is called “debug”, from the English “debug”).
Below we will consider the main methods of using the debugging mechanism in the form of practical instructions using a specific example.
Attention! If you use client-server mode (on the server), you need.
The easiest way to start debugging in 1C is to open 1C in mode and from it start debugging mode in desired mode work (thin/thick, controlled/regular):

Debugging background jobs 1C
In order to be able to debug background jobs, you need to go to the “Debugging - Connection” menu. In the window that opens, click the “Automatic connection” button:

In this window you can set the corresponding flag.
In addition to background jobs, in this window you can enable debugging of external connections, http and .
Setting a breakpoint
The second step in debugging is setting a breakpoint (in other programming languages - breakpoint).
For example, I selected the “On change” handler on the document form for debugging:

In order to set a breakpoint, you need to find the desired program code and double-click on the field to the left of the code entry field (or press the F9 button):

To see a list of all installed ones, you need to go to the Debug menu - List of breakpoints (alt + F9):

Get 267 video lessons on 1C for free:
Breakpoint 1C with condition (blue)
In addition to the usual breakpoint in 1C, there is another type of breakpoint - with a condition. Graphically, such a point is displayed in blue. This breakpoint is very useful when you need to catch a specific iteration while traversing a loop. Debugging will turn on when a certain condition is met.
For example, let's stop the loop at line number 25:

Inactive breakpoint (gray)
A gray breakpoint means it is not active and the system will not stop at that breakpoint. You can make it inactive by clicking the special button on the “Disable Breakpoint” panel (shift+ctrl+F9):

Error breakpoint
The system can stop due to an error; to do this, you need to set the corresponding flag in the Debug - Stop by error menu:

Also, an error stop has functionality similar to a conditional breakpoint - it allows you to filter exceptions with a specific error text.
Step-by-step movement through 1C program code
After setting a breakpoint, you must initiate execution of the desired program code so that the system enters step-by-step code execution. The display of an arrow indicates the start of step-by-step code execution mode:

In order to take a step to the next line, you must press the “F11″ (Step into) button.
If you step through lines of program code and there is a procedure or function on the line, then you will “fall” inside this procedure (or function).
In order not to “fail,” it is enough to instead of F11 (Step into) jump through the lines with the F10 (Step through) button; this button allows you to step through procedures in the program code.
To move from the current cursor position to the desired one, bypassing intermediate lines of code, you need to set the cursor to the required line and press shift + F10 (Go to cursor).
Analysis of values in 1C debugging mode
View values certain values can be done in different ways:
Display value on hover
When you hover over a variable, the system “highlights” the variable’s values:

Using Evaluate Expression or Tableau
- Form Evaluate Expression can be called using context menu or pressing shortcut keys- (Shift + F9), or menu (Debug - Evaluate expression).
- Scoreboard called using the shortcut keys Ctrl + Alt + W or from the menu (Debugging - Tableau).
These two analysis methods are very similar, the main differences are in the interface. It is more convenient to use a scoreboard for a group of indicators, and expressions for single indicators.
These methods are very easy to use. It is enough to enter the name of the desired variable in the table. A big plus of arbitrary calculations is that you can add your own data to the expression.
For example:

It is very useful to use expression evaluation and run a query, upload it to a table of values and look at it.
How to find out where a procedure is called from in debugging - Call stack
Very often you need to understand where a particular procedure or function was called from and with what parameters. For this purpose, 1C provides a special function - “Call Stack”. To launch the Call Stack, you must press the hotkeys - Ctrl + Alt + C or through the menu (Debugging - Call Stack).
Using it, you can find out in detail where the procedure was called from and with what parameters:

If you are interested in evaluating performance during debugging - .
See also an overview video on debugging in 1C: