On 1C? how to view employee salaries in 1s?
Often, when working with 1C, an accountant realizes that the functionality built into the standard configuration is not enough. Either it turns out that you don’t know where to look for the necessary data, or you realize that the report does not display all the necessary summary results.
It turns out that many similar problems can simply be solved by creating a custom selection and outputting this data to a report.
You can make such a custom, “your own” selection in several ways. Can
in the configurator, write program code that includes a request that will process the data in the infobase and output the data to the one we created. This good method, it allows you to completely manually control the report generation process and make adjustments at any stage of creating the final document. But in order to write the program code for the report and create the final one, you need to have sufficient qualifications, which is often for an accountant or a beginner system administrator it can be difficult.
You can also make the necessary report using the so-called ACS. This is an abbreviation. So it is a Data Composition System. Looking ahead, I will say that this method is simpler, because... has a graphical method for displaying the structure information base and does not require, in most cases, knowledge of the syntax of the built-in 1C language.
In order not to carry on an unfounded conversation, we will now move from theory to practice. Simply put, we will create a report on the access control system in the 1C program, standard configuration Accounting 8.3. Because Since the configuration is typical and removing it from support is not part of our plans, we will make the report external. Which, however, will not affect the creation process.
So, let's begin
Preparation of a report.
First, let's create and save our external report file to disk.
At this point we need to decide what we will achieve from the 1C database. Those. what data we should display in the generated report. Let’s assume, for example, that the responsible employee of the accounting department needed to produce a report for a certain period on the salaries received by employees in the context of advances and salaries themselves, indicating positions and decoding documents. It seems that such a report will be of interest not only to accounting employees.
First, go to 1C Configurator and click “File” - “New” in the main menu. In the proposed list, select “External report” and click the “Ok” button to confirm the choice.
Let’s call the newly created report “Employee Salary Report”, for example, and save it to disk.

Creating a report on the access control system.
After saving the external report to disk, click the “Open data composition scheme” button and confirm the creation new scheme by clicking on the “Done” button.


In the form that opens, create a data composition scheme new set data - request. We will obtain the necessary information using an SQL query.


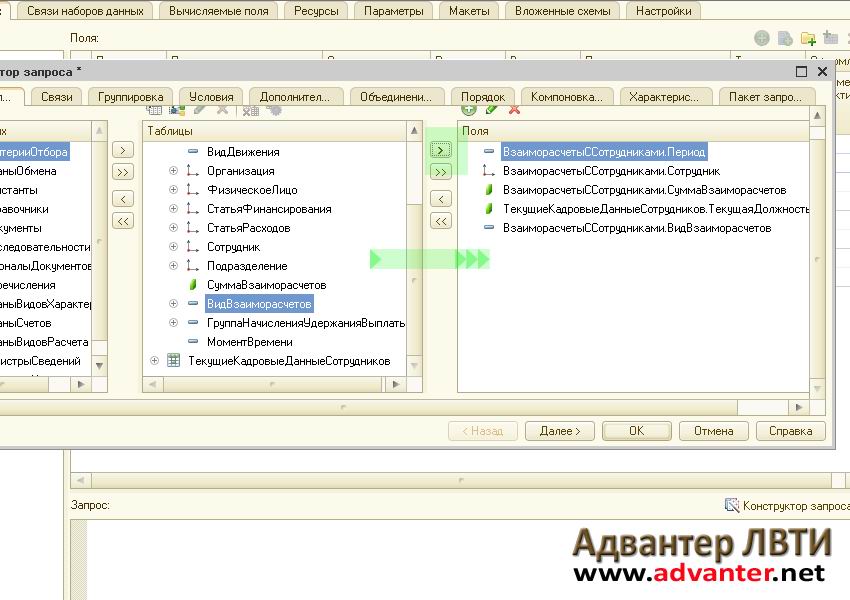
Finally, we have come to the creation of a tool for obtaining the sample data we need. In the query designer, we will select the metadata objects that will participate in the result.
From the column with metadata objects (“Databases”), select tables containing data for our report. We will need: the accumulation register “Mutual settlements with employees” to obtain data on salary movements and the information register “Current Personnel Data of Employees” to obtain information about the position of each specific employee.


Next, similarly, from the details of these two registers we will select the fields that will form our report. These are Period, Employee, Settlement Type, Settlement Amount, Current Position and Registrar. We will need a registrar for subsequent decryption of financial documents.
On the “Links” tab, we will create a connection of our selected registers using the “Employee” field

On the “Conditions” tab, enter the condition for selecting the type of mutual settlements. Let's add the Settlement Type parameter, which we will set later at one of the following stages.

Also, to determine the period, we will create two conditions that, in fact, will limit the required period. Let these be the parameters DateFrom and DateTo. We will finally describe them at the next stage. Note that to set the period it is convenient to specify the “Between” operand.

We do not need the remaining tabs; at this stage, the completed data will be sufficient to generate the report we need.

Click the “Ok” button
The SQL query we need will be generated in the field.

Generating report parameters
Let’s go to the “Resources” tab and configure the output amount so that this data is calculated based on the employee.

Options.
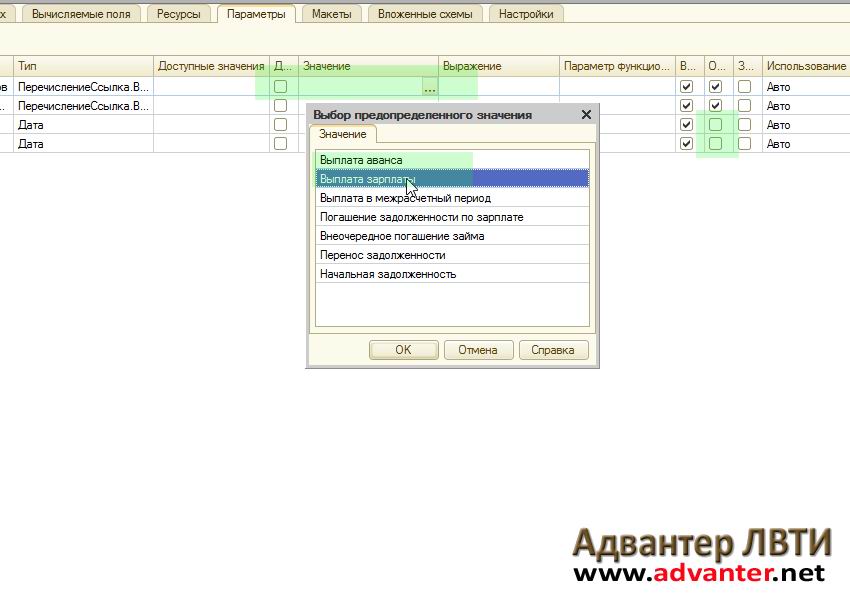
Let's go to the "Parameters" tab. Here we see that the system automatically added the previously entered Settlement Type parameter and two parameters for determining the period. All we have to do is slightly modify the generated Settlement Type line for our report. Because We will need a sample for both salary payments and advance payments, then we will also need the Settlement Type parameter twice.
Copy the line Type of Mutual Settlement by clicking on the first one with the right mouse button.

Next, we indicate that we need data on advances and salaries. For one line of types of mutual settlements, we will select advance payment, for the second - salary. We will also remove the availability restriction for period parameters. This is important because the user will be able to set the period independently.
Formation of the sample type.
For our simple case, we only need to generate a report list without additional settings. Therefore, right-click on the “Report” line and select “Settings Designer”. Let me note for those interested that the access control system, in fact, allows you to work quite widely with sample data to create the appearance of reports. For this there are others, fine instruments. But we are considering the simplest example, so we will limit ourselves to the “Settings Designer”.


In the next window, select the fields that will be displayed in the report. These are Employee, Period, Settlement Type, Current Position, Settlement Amount and Registrar. After editing, click “Next”.

Then, in the next window, we define the right type groups. This is for the Employee field. Click “Next”.

And, in the last window we will assign an ordering field. Sort by the Settlement Amount field, in descending order. click “Ok”. 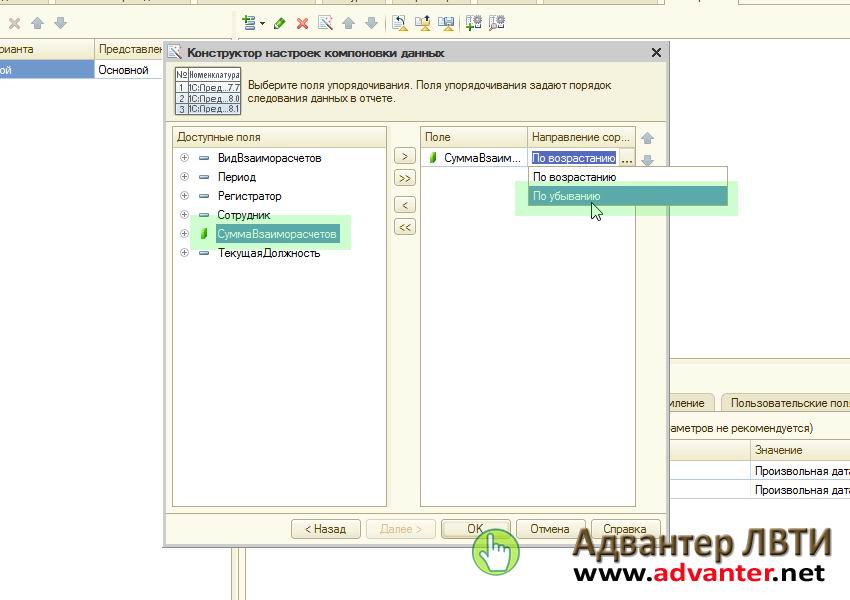
A few finishing touches and our report will be ready. For better visualization, let's add a grouping field Current Position. To do this, double-click the “Employee” line and add the required field. Confirm the selection with the “Ok” button

“I need this report in 1C in an hour!”- 1C specialists often hear this phrase from the Customer. What to do in such a situation? If there are suitable blanks, you can try to use them. Download something from the Internet - what if it doesn’t work or isn’t suitable? And this is where it comes to the rescue processing "Query Console".
If you, dear reader, are a Customer and you there is a 1C specialist, then you need to let him read this article, and very soon you will have the report you need.
If you have there is no 1C specialist, you use standard Enterprise Accounting 2.0 or 3.0 or Trade Management 10.3, 11 or 11.1, then you can register on this site, and then in the comments to this article or by email to the site administration in free form write what kind of report you need indicating your configuration (you must specify the release of the configuration and platform). If our library of reports contains the report you need, we will be happy to give it to you with instructions on how to use it.
And now information for 1C specialists:
First, let's figure out what the Customer really needs. In most cases, we are not talking about some complex report with a large number of settings and the ability to edit it appearance, but simply about some list of elements of a particular directory or a list of documents for a certain period with a filter (usually by organization, counterparty or counterparty details). The appearance of the list is often not important to the Customer and he usually does not need any groupings.
And so, to quickly solve such a problem, the Query Console processing is ideal. In short, the “Query Console” is an external processing that allows you to enter queries in the 1C Enterprise language, fill in the parameters of these queries and display the query result in a spreadsheet document. And most importantly, this processing allows you to save a list of requests to a file and use these requests in the future. You can soon read in detail about how to use this processing in an article on this site, and here we will describe the process of how to quickly make a simple report and transfer it to the Customer.
1. The processing itself is “Query Console”.
At initial installation configuration, we always save a set of external processors in the database, among them the “Query Console”. If this has not been done, it can be done at any time.
It must be said that there are many options for this processing, both for a regular application and for a managed one. You can find and download them, for example, by following the link:
In our work, for the Regular application we use a slightly modified Query Console from the ITS disk, and for the Managed application this (also slightly modified):
http://infostart.ru/public/126781/
Let's open the Query Console. It will look something like this:
Processing window “Query Console”
You can customize the appearance of the window using the top checkboxes.
2. Write a request in the “Query Console”.
In our work, we create general request files for all configurations and a request file for each configuration of each Customer. What Request files you will have is up to you to decide; this is a matter of organizing the work.
For example, the Customer asked us to display in UT 11.1 a list of all Invoices issued (both posted and not posted), indicating the counterparty in the displayed list and selecting by organization and period.
In our processing, on the “Requests” tab, click the “Add” button. We name the request, for example, like this: “Invoices with counterparties.”
Since the Query Builder is not available in the thin client, we write something like this in the Configurator:
CHOOSE
InvoiceInvoiceIssued.Number,
InvoiceInvoiceIssued.Date,
InvoiceInvoiceIssued by.Organization,
InvoiceInvoiceIssued.DocumentBase.Counterparty,
InvoiceInvoiceIssued.Posted,
InvoiceInvoiceIssued.DocumentBase.Amount ofDocument
FROM
Document.InvoiceInvoiceIssued AS InvoiceInvoiceIssued
WHERE
InvoiceInvoiceIssued.Organization = &Organization
AND Invoice Issued.Date BETWEEN &StartDate AND &EndDate
From the Configurator via the clipboard, copy the request text into the “Request text” field. The processing window will look something like this:

Processing "Query Console" with the entered query
Open the “Options” tab. We fill in the parameters there (if they are not visible, then click the “Fill in parameters” button).
Click the “Request” button in the upper left corner.
In the “Query Result” table field we see what the Customer wanted.
We save the list of requests to a file.
That's it, now at any time and anywhere we can open the Query Console, open a file in it and execute a query.
IMPORTANT: If you have a ready-made query file, then you do not need to have programming skills to receive the necessary reports.
3. We transfer the file with requests to the Customer if there is no remote access to it.
If the Customer's computer has remote access, you can skip this operation - it already has a file with requests, otherwise we save the request from processing to a file and transfer it in any way.
P.S. There is also a processing called "Report Console", in which you can make full-fledged reports in a similar way, but we’ll talk about it a little later.
To get started with regulated reports, use the desktop form.
Program desktop form
When you start the program, the program desktop form opens.
The left side of the form displays groups of reports, the top shows the selected taxpayer and the period for which the reporting is being submitted, and the right side shows a list of available actions. The main part of the form displays a list of report forms for the current group.
The desktop form is intended for filling out new reports. Before you start filling out the report, you need to do the following.
1. By clicking on the appropriate hyperlinks, select the taxpayer and the reporting period.
2. Select the desired report group on the left.
3. In the list of reports, double-click on the name of the desired report.
As a result, a regulated report form will open on top of the desktop form, prepared for data entry, where the details of the selected taxpayer and the specified reporting period will already be inserted.
Regulated report form
The regulated report form is intended for entering data into the report form. In this case, some data will be calculated automatically.
The left side of the form displays the table of contents of the regulated report - a list of its sections.
Filling individual cells
The report form contains cells of different colors.
Cells with a white background are an analogue of printed paper report form elements - accordingly, the data in these cells cannot be adjusted by the user. Cells with a different background color are filled by the program or user, but:
- cells with yellow background intended for manual filling;
- cells with green background are calculated automatically based on data entered in other cells, but they are not available for correction.
Selecting a value from a list
To quickly fill out indicators, the program provides the user with a convenient mechanism for selecting a value from the list. By double-clicking on an indicator, you can call up a list from which you can select the desired value.
Setting up a regulated report
The user can configure the parameters of the regulated report and its display parameters.
If the number of lines in any part of the report is not agreed upon in advance, then when drawing up the report, you can add additional lines to the form.
For some sections, it may be possible to add a set of entire pages - in cases where this does not contradict regulatory documents.
Checking the report
"1C:Taxpayer 8" provides the ability to automatically check completed regulated reports for the interrelation of report indicators specified in different sections of the report or for different periods, as well as with other regulated reports.
Rating: / 0
Today we will talk about settings in reports in “1C:Enterprise” 8.2 or 8.3, using the example configuration 1C:Enterprise 8. Trade management for Ukraine
Update
We have supplemented the article with settings for configuration on controlled forms and wrote about some tricks for setting up reports in 1C:Enterprise 8. Trade management for Ukraine, ed. 3.1 (managed forms)
Let's look at how using an example configuration Trade management for Ukraine
You can easily and quickly customize the report exactly to your requirements.
Managed forms mean that the appearance of reports can be customized to suit you. After all, previously, if a user wanted to change report settings, he had to ask the programmer to “finish” the reports he needed. Now you can customize any report yourself without the help of a programmer.
Report settings in 1C:Enterprise 8. Trade management for Ukraine, ed. 3
To configure the report, click on the button Settings. A window with settings opens in front of us.

To see all (advanced settings), click All actions → All settings

In this window we can add the fields we need, group fields, make selections, and much more.

In the period line – we can choose for which period we want to see data.
Selected fields – here you can add missing fields

On the selection tab we can select only those elements that you need to see.
Types of comparison:
- Equals– You can only select one value
- Not equal- value for which you do not want to see data
- On the list– if you want to select several values
- In a group from the list- you can select a list of several data groups.
- Not on the list- selection of a list of positions that should not be included in the report
- Not in list group– excluding the list of data groups from the selection
- In Group– in this case you will see data for only one group/category
- Not in group- data group exclusion
For example, in a list of goods in warehouses, we want to see all the goods that we have in stock. To do this, set the Final balance selection to greater than 0.

Now our report looks like this:

On the sorting tab we can sort our data.
For example, we want to sort our products alphabetically. To do this, go to the sorting window. And simply drag the “Nomenclature” attribute to right side window and set the sorting direction to “Ascending”.

The report started to look like this:

On the Grouping tab we can group data by some value. For example, we want to see our balances in terms of warehouses. Everything is simple here: we click on the three dots, go to the editing groupings window and add a new “Warehouse” grouping and select the “Hierarchy” type.


We will also group by month, that is, we will find out in which month we received the goods.
To do this, add the following grouping: Period month (it is also possible to group by years, quarters, days)

Now let's look at the appearance of our report:

As you can see, in the settings we have doubled the grouping by warehouses. How can we find out where the extra group came from? Since in managed forms you can design a report yourself, so let’s go into the report structure itself. To do this we go to

We see the structure of the report:

That is, the report is structured as follows: first there is grouping by warehouses, then subgroups: grouping by Nomenclature, characteristics, series and units of measurement, after which there is grouping by movement documents, and the last independent grouping is unit of measurement
If we simply disable the Warehouse checkbox, then 2 groups will be disabled: item and registrar. Therefore, we simply “grab” the Nomenclature line and drag it into the Report. Uncheck warehouse. Now the structure of our report should look like this:

Now the report looks nice:

On the item fields tab, we can select only those fields that we want to see in the report. For example, in the List of goods in warehouses report, we want to see the article number of the item, the name of the item, the characteristics of the item, units. measurements. To do this, go to the Item Fields tab and set all the above listed details. Also, in order for the name of the item and its characteristics to be in one column in the report, it is necessary to place these details in one group (as shown in the figure).

Using the Conditional Appearance tab, we can also make our report in color. For example, we want to quickly find the quantity of a product in a certain warehouse. To do this, highlight a specific warehouse with color:
On the Condition tab, select the warehouse that we want to “paint”. Warehouse = Groceries Store

On the design tab, select which color (choose yellow):

On the Formatted fields tab we can see which fields/columns we will change in color. If we leave this tab empty, the program will fill in yellow everything about the “Products Store” warehouse

Now let’s create our report!
Now it looks like this:

First we see grouping by warehouses, then grouping by month.
You can switch between settings thanks to a button like - Select settings:


Our setting is this moment is available only to us, but if we want to add it to other users, then we need to go to the section Administration → User and rights settings → Copying settings

On the Report Settings tab we see all the reports whose settings we saved, and now we select our setting.
Now all we have to do is copy and close.


There is one more trick with reports on managed forms: you can add columns and rows in a slightly different way.
Let's go through All actions → Change report variant
The following window opened before us:

Here we can also group, sort, add columns/rows. In general, everything your heart desires.
And using the example of the Gross Profit report, I will show how you can add the Markup column.
We also go to settings via All actions → Change report variant.

In the window that appears, write the name of our column: Markup.
In the Expression of total records field, enter the formula: Revenue/Total*100 – 100

On the left we find a folder called Custom Fields and see the newly created Markup
Add it to the right column

Now let’s add our markup to the report structure: Organization and Divisions:

And let's finish editing.
Let's generate a report.

We see that new column appeared, but to put it mildly, we are not satisfied with the number of decimal places. But this is also very easy to fix.
We need to return to the settings, namely to the Custom Fields tab, and edit our formula. The number format we want to see is 2 decimal places.
We make the following formula: Format(Revenue / Total * 100 - 100, “NAV = 2”)

Let's generate the report again.

Now we see that everything is in order!
But it happens that an error pops up: “Division by zero.” To avoid such an error, let's write the formula as follows:
Choice
When Total<> 0
Then Format(Revenue / Total * 100 - 100, “NAV = 2”)
Otherwise 0
End
We can also add a new plate to our report. To do this, we also go to Change report version. Further Add → New Table.

Now let's add rows and columns.
Let's say we want to see gross profit only by segment Appliances.
Let's add the following groupings to the lines: Nomenclature.
On the Selection tab, enable the “Current item has its own selection” checkbox and add items from the household appliances group.
On the Fields tab, also enable the checkbox “The current element has its own settings for the selected fields” - Nomenclature.
In the structure of our table, namely columns, we add a new grouping, leaving the field empty.


Let's call our table: Household Appliances. To do this, go to the Table and on the tab Additional settings Let's enter a title (as shown in the figure below).

Now let's generate a report.

Our new sign was included in the gross profit report.
Everything is elementary!
Report settings in 1C:Enterprise 8. Trade management for Ukraine, ed. 2.3
Reports in 1C:Enterprise are a constructor, but not every user knows about the intricacies of report settings.

We set up reporting, click the Save settings button on the report panel, Create a new one, write the name of the report. If you want this report to open when opened, check the Open column.
To open necessary settings report, click on the Restore settings button, and double click select the desired setting. Don't forget to click the Generate button.
2. How can I customize a more detailed report?
Open the required report, click the Settings button, check the Advanced settings checkbox at the bottom, you will have additional bookmarks.
General tab
Use checkboxes to indicate which columns you need to see in the report and which not.
Use arrows to select the location of the columns.

Groupings Tab
On this tab, you can add/remove those columns/rows that you would like to see in the report, as well as transform the data for easy viewing.
Grouping rows - data will be generated downward, Grouping columns - data will be generated to the side (to the right). For example, in Row Grouping you can view sales data by item, and in Column Grouping you can see these sales by month.
You can add any field to fill in data in the report. Click the Add button, the Select Field window appears, where there are all the options that can be added to the report. We select the required option (with the plus sign you can reveal more information, for example, you need to look at the data in the context of the product article, then you click on the product and everything that relates to the product expands). Click OK to add a new field.

Row/column grouping type is an option for viewing data (grouping), for example Hierarchy, allows you to collapse/expand results.
3. How can I make a selection in a report based on a specific element of a directory/document/group of directories?
Tab Selection allows you to make a selection not only by those rows/columns that are already in the report settings, but also to add your own Selection option.
To do this, click the Add button and add the option you need from the Field Selection window. By ticking we make a choice for which element we will have a selection. Thanks to the Comparison Type column, we can choose not only separate element, but also groups.
Comparison type
Equals- select only one position
Not equal- one position for which you do not want to see data
On the list- the ability to create a list of positions that you want to see in the report. Through the List Selection window, create the required list of directory/document elements.
In a group from the list- you can select a list of individual groups/subgroups. In order to select exactly the group folder, you need to click the Select button, and so make a list of those subgroups for which you would like to see selection.

Not on the list - selecting a list of positions that should not be included in the report
Not in list group- selecting a list of groups/subgroups that should not be included in the report

In Group- you can select only ONE group (to select a group you must click the Select button)
Not in group- selection for one group that should not be included in the report.
4. How to create additional fields in separate columns?
Additional fields tab allows you to create additional fields in a separate column
- Add the required field
- Select Placement, in a separate column or in one column that is already in the report
- Select Position, before the Grouping column (that is, the first column), after the Grouping (second column), or instead of Ggrouping (that is, there will be no Grouping column at all).

5. How to sort a field in a report in ascending/descending order?
For example, we need to display product sales statistics; at the beginning of the report we will have the best-selling product.
Tab Sorting
Select the field that needs to be sorted - this will be the Quantity field (in base units), select the Descending sort option. And first we look at the best-selling product. If you need to look at a poorly selling product, then select sorting by Ascending.
6. How to remove zeros after the decimal point from a quantity in a report
Tab Design
Select the Quantity in basic units area in the column, open the Design column, check the box next to the Format field and open the value.
Next to the Length field, put a checkmark and select the maximum length of your number. If you need to set the fractional separator (that is, how many digits should be after the zeros), then check the box and select the number of decimal places. If you don't need fractional parts, then don't change anything.

We press the OK button, this setting goes to the Edit Design Settings window, we also click OK there, and now this format setting is included in the Design Tab.
We generate a report, and our quantity is now without a fractional part.

* Using the Design tab, you can select different design options. In another lesson we will provide options for setting up the report design.
7. Duplicate report settings for other users.
For example, we have managers who need to save the same Sales report in their settings. There are 7 of these managers, and the report settings are serious, and duplicating this seven times for each user is completely troublesome.
There is a way out!
- First, let's set up this report for one manager and save it.
- Then we go to the second manager’s database, open the Sales Report, click on the Restore settings button, this list is empty (since the second manager did not have saved settings).
- Click on the Settings all users button at the top, and now this list contains all the reports that were saved by users.
- Select the desired report, click Generate, and we have the report that we configured for the first manager
- Now we click the Save button and the settings of this report are saved for the second manager.

Today we told you just a few tricks for generating reports in 1C:Enterprise, of course these are not all the secrets, look for the rest in our next lessons.
We hope this lesson was useful to you! Thank you for your attention!
Best regards, company Fin Soft
You can learn this from us in the online courses “1C:Enterprise”, or enroll in our courses “1C:Enterprise”, which take place in our office.
If you have not purchased this program yet, you have an excellent opportunity to buy 1C:Enterprise 8. Trade Management for Ukraine on our website Below we have collected similar topics for you that will help you understand the functionality of the 1C:Enterprise program.
- < Назад
- Forward >
Secrets of setting up reports in 1C:Enterprise 8.3 - 4.5 out of 5 based on 6 reviews
Step 1. Where is the Universal Report in 1C 8.3
The universal report in 1C 8.3 is called through the Reports – Universal report section:
The Universal Report form looks like this:

Step 2. How to generate a universal report to find errors in accounting
There are situations when business transaction using an Operation entered manually: the amount on account 68.02 was reflected, but no movements were made in the VAT accumulation register of the Purchase. As a result, the amount in the Purchase Book does not match the amount in the balance sheet for account 68.02.
Important! To understand which register to use to generate a Universal Report in 1C 8.3, you need to go through the flowchart presented below and understand as a result of which document you can find the required register:

It is enough to know that the data in the Purchase Book is collected according to VAT register Purchases to generate a Universal report on it. Since we will compare the Universal report with account card 68.02, the report must be configured so that the information in both the card and the report is presented in a single key.
Step 3. How to set up a universal report in 1C 8.3
Let's configure the report as follows by clicking on the Show settings button:
- On the Grouping tab, use the Add button to add the lines Organization and Registrar. At the same time, we added a grouping by organization to see the total amount by organization for easy comparison with the total amount in the card:

- On the Selection tab, set the selection for the desired organization using the Add button:

As a result, the report will look like this:

In this form, it is easy to compare with account card 68.02, since they have a similar structure. This allows us to understand which document has not made any movement in the Purchases VAT accumulation register or in the accounting register:

Here is an example table of registers that it is advisable to check if an error is detected in a particular accounting section:

Attention! Very often it is not enough to correct one register: perhaps the error will not go away, but will become more hidden and problematic. In particularly difficult cases, it will be necessary to correct a set of registers, and in this case it is better to give the 1C 8.3 database to a 1C specialist programmer for analysis.
Step 4. How to fix the found error
In our example, in the account card 68.02 there was an “extra” document Transaction entered manually, which generated amounts in the accounting accounts, but did not generate movements in the Purchases VAT accumulation register and did not end up in the Purchases Book. That is, in this case you need to add movement along this register to this document. How to do this is described in detail in.
As a result, we get the following picture:

Step 5. How to use the Universal report in 1C 8.3
A universal report in 1C 8.3 can be built using directories, information registers, documents and accounting registers.
According to the accounting register
For example, instead of an account card, you can generate a Universal report on accounting registers with the following settings:


In order not to clutter the report on the Indicators tab, uncheck the boxes for unnecessary indicators:

Using the following window management commands:

You can place report windows side by side for easy data comparison:

By information register
For example, in 1C 8.3 it is necessary to find information on employees who already have personal bank accounts opened to transfer wages.
We will generate a Universal report for the information register of the same name, making the following settings:


If there are several organizations in the 1C 8.3 database, you can set the selection for the desired organization on the Selection tab. We get this option:

According to the directory
Suppose you need to get a list of Buyers with their addresses and phone numbers from the 1C 8.3 database. Let's make the following settings:

Important! We made a selection based on whether the counterparty was included in the Buyers group of the Counterparties directory, but if the user made a mistake and included the purchasing counterparty in another group, then this counterparty may not be included in the report.

The figure shows that the names of the indicators are in brackets, and next to them is the column heading, which is more understandable and readable for the user, which will be displayed in the report. To change the title, click on the line with the indicator right click mouse and select “Set title”:

As a result, we get a report like this:

How the Universal report works in 1C
Let's consider a few more questions, the answers to which can be obtained using the Universal Report in 1C 8.3.
Question No. 1
How to make a selection in a Universal report only for a specific buyer and find out how much of a specific (certain) product range was sold to him?
Answer: When posting a Sales document (act, invoice) in 1C 8.3, movements are formed in the accounting register and VAT Sales (we do not take it in the case of separate VAT accounting). There is no analytics for goods in the VAT Sales register, so you will have to take data from the accounting register.
In this case, the Universal report is configured as follows:
- Period;
- Accounting Register;
- Posting journal (accounting and tax accounting);
- Subconto movements:
- Next, click on the Show settings button and add the following values on the Selection tab:
- Account Dt – Equal to – 62.01;
- Account Kt – Equal to – 90.01.1:

- On the Grouping tab the following values are added:
- Subconto 1 Dt;
- Subconto 3 Kt:


- After these settings, you need to click the Generate button and the Universal report in 1C 8.3 will be built in the required form:

Question No. 2
Expenses do not include wages, taxes and contributions. These expenses are not visible in KUDiR. The simplified tax system for payment is calculated without these expenses. How to find an error using the Universal Report?
Answer: Let's build an analysis in the Universal Report based on the accumulation register of Expenses under the simplified tax system. In this case, the Universal report is configured as follows:
- In the report header for selecting information, the following values are indicated:
- Period;
- Expenses under the simplified tax system;
- Balances and turnover:
- Type of expense;
- Consumption element:

- On the Indicators tab, the values should be set as in the figure:
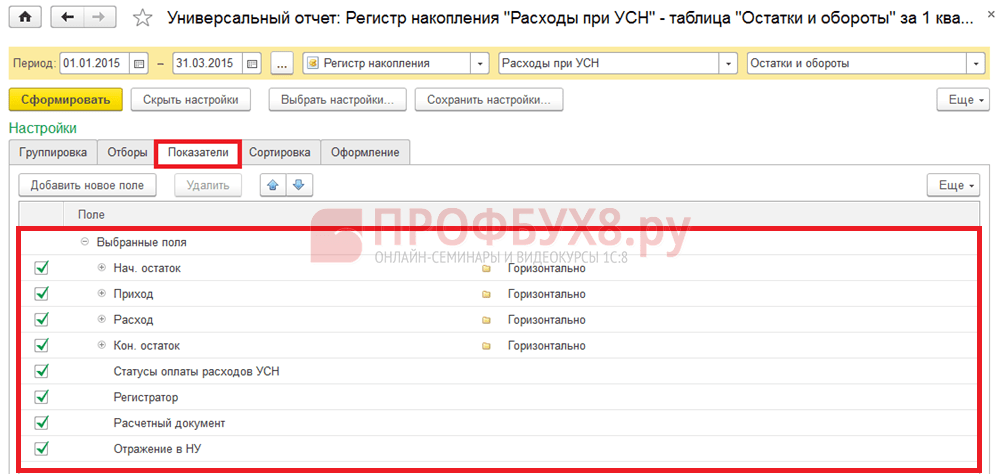

From the report we see that some expenses in the column Reflection in NU listed as Not accepted. This means that these expenses will not be automatically included by the program in KUDiR and an error was made when entering documents. It is necessary to correct the analytics in such documents, that is, the cost item must have the value Accepted in NU as shown in the figure:

After this, you need to re-post the payroll documents and re-close the months.
Question #3
In KUDiR, NU expenses do not include the cost of goods sold. How to find an error using the Universal Report?
Answer: In 1C 8.3, expenses are accepted into KUDiR in accordance with the conditions set in the accounting policy. When selling goods in accordance with the Tax Code of the Russian Federation, the following conditions are: the goods must be capitalized, payment for them must be made to the supplier, and the sale of these goods must be reflected. When all three conditions are met, the costs will be included in the KUDiR.
Let's build a Universal report in 1C 8.3 for the accumulation register of Expenses under the simplified tax system and clarify the conditions that are not met for acceptance as expenses in the NU. In this case, the Universal report is configured as follows:
- In the report header for selecting information, the following values are indicated:
- Period;
- Accounting accumulation register;
- Expenses under the simplified tax system;
- Balances and turnover:
- Next, click on the Show settings button and add the following values on the Grouping tab:
- Type of expense;
- Consumption element:

- On the Indicators tab, the values should be set as in the figure:

- After these settings, you need to click the Generate button and the report will be built in the required form:

As can be seen from the report, the reason why expenses for purchased goods do not fall into KUDiR is the lack of payment to the supplier for the goods.
Consequently, either the payment for the goods to the supplier was not made correctly, or it simply simply did not exist, and therefore the expense for the purchased goods should not fall into the KUDiR.
Question #4
How to view the price of goods receipt in 1C Enterprise 8.3 (8.3.8.1964) using the Universal Report?
Answer: There is no special report for tracking the price of goods receipt in 1C, but you can build your own report using the Universal Report on Receipt documents (act, invoice). In this case, the Universal report is configured as follows:
- In the report header for selecting information, the following values are indicated:
- Period;
- Document;
- Receipt (acts, invoices);
- Goods:
- Next, click on the Show settings button, and on the Grouping tab, add the Nomenclature value:

- On the Indicators tab, the values should be set as in the figure:

- After these settings, you need to click the Generate button and the report will be built in the required form:

ATTENTION! Please note that not every problem can be solved using the Universal Report. Its main inconvenience is that it works ONLY with one object of analysis: a directory, document, accounting register, information register or accumulation register.
It does not track complex connections between objects. For this purpose, there is a special DCS tool – Data Composition System. With its help, programmers and experienced users can generate complex reports, select necessary information, add your own fields for calculation.