This series of articles appeared for two reasons. First of all, I like working with the project HackSysExtremeVulnerableDriver. Secondly, I received a lot of wishes to cover this topic.
All code used in writing this series is in my repository.
In this series of articles we will look at writing kernel-level exploits in Windows. It's important to note that we will be dealing with known vulnerabilities and there is no need for reverse engineering (at least for the driver).
It is expected that after reading all the articles, you will know all the most common classes of vulnerabilities and methods of exploitation, and will also be able to port exploits from x86 architecture to x64 architecture (if possible) and become familiar with new protection methods in Windows 10.
Kernel debug circuit
Unlike user-level debugging, which suspends the execution of a single process, kernel-level debugging involves the entire system, and we will not be able to use this method. Accordingly, we need a separate debugging machine that can communicate with the system where the kernel is being debugged, view memory and kernel structures, and also catch system crashes.
Additional material to study:
Exploiting kernel vulnerabilities
This process is much more fun than operating at the user J level.
The main goal is to achieve privileged execution in the context of the kernel. And then everything depends on our imagination, from a feast with homemade beer to the introduction of state-sponsored malware.
In general, our task is to obtain a shell with system privileges.
Topics of articles in this series
- Part 1: Setting up your work environment
- Configuring three virtual machines and a system that will act as a debugger.
- Configuring the WinDBG debugger.
- Part 2: Payloads
- Explore the most common payloads. Subsequent parts will address specific vulnerabilities and, where appropriate, provide links to this article.
- The remaining parts.
- Consideration of vulnerabilities.
Life cycle developing a kernel level exploit
- Finding a vulnerability. This topic will not be discussed in this series, since we already know exactly where the gaps are.
- Intercepting the thread of execution. Some vulnerabilities involve code execution, and some have additional requirements.
- Privilege escalation. The main goal is to get a shell with system privileges.
- Restoring the thread of execution. Unchecked exceptions at the kernel level cause the system to crash. If you are not going to write an exploit for a DoS attack, you should take this fact into account.
Types of target systems
We will work with vulnerabilities in the following systems (the specific version is not important):
- Win7 x86 VM
- Win7 x64 VM
- Win10 x64 VM
Let's start with the x86 architecture, and then we will port the exploit to the Win7 x64 system. Some exploits will not run on Win10 machines due to the presence of new protections. In this case, we will either change the logic of the exploit or use a completely different approach.
Software used:
- Hypervisor (lots of options).
- Windows 7 x86 VM
- Windows 7 x64 VM
- Windows 10 x64 VM
Setting up systems for debugging
The debug systems we will be interacting with are designed to load the vulnerable driver. These machines will crash frequently, since most exceptions in the kernel contribute to this type of phenomenon. It is necessary to allocate enough random access memory for these systems.
On each machine that will be debugged, you need to do the following:
- Inside the VirtualKD directory, run the file target\vminstall.exe. A new boot entry will be added and debugging and automatic connection to the VirtualKD server installed on the system, which acts as a debugger.
In the case of Windows 10 VM, you need to enable test signing mode, which allows you to load unsigned drivers into the kernel.
After running the bcdedit /set testsinging on command and rebooting, “Test Mode” will appear on the desktop.
Brief description of the HEVD module
The DriverEntry procedure is the starting procedure for each driver:
NTSTATUS DriverEntry(IN PDRIVER_OBJECT DriverObject, IN PUNICODE_STRING RegistryPath) (
UINT32 i = 0;
PDEVICE_OBJECT DeviceObject = NULL;
NTSTATUS Status = STATUS_UNSUCCESSFUL;
UNICODE_STRING DeviceName, DosDeviceName = (0);
UNREFERENCED_PARAMETER(RegistryPath);
PAGED_CODE();
RtlInitUnicodeString(&DeviceName, L"\\Device\\HackSysExtremeVulnerableDriver");
RtlInitUnicodeString(&DosDeviceName, L"\\DosDevices\\HackSysExtremeVulnerableDriver");
//Create the device
Status = IoCreateDevice(DriverObject,
0,
&DeviceName,
FILE_DEVICE_UNKNOWN,
FILE_DEVICE_SECURE_OPEN,
FALSE
&DeviceObject);
- This procedure contains a call to the IoCreateDevice function, which contains the name of the driver that we will use during communication.
- The necessary structures and function pointers will be added to the DriverObject object.
- What is important for us is the function pointer associated with the DriverObject->MajorFunction procedure, which is responsible for processing IOCTL (I/O Control);
- In HEVD this function is called IrpDeviceIoCtlHandler which is a big conditional expression with multiple branches for each IOCTL. Each vulnerability has a unique IOCTL.
Example: HACKSYS_EVD_IOCTL_STACK_OVERFLOW is an IOCTL used to trigger a stack overflow exploit.
This concludes the first part. In the next article we will talk about payloads. On this moment The only payload available is one designed to steal tokens, which will be used in the third part.
P.S. I understand that there are a lot of intricacies and problems that you may encounter. Since this series focuses on developing exploits, you will have to solve all the associated problems yourself. However, you can ask any questions you have in the comments.
How to start the kernel debugger?
Master's answer:
On development stage software There is one very important component - debugging. Towards application programs it is carried out by means that work in user mode and often built into the IDE. In order to be able to debug, for example, drivers, you need to run the kernel debugger.
Need to start the processor command cmd. Open the Start menu on the taskbar. In the window that appears, click on the “Run…” item. The “Run Program” window will appear. In the text box, enter cmd, then click OK.
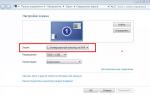
Now create backup copy boot.ini file. First find out the installation path of the current copies of Windows, using the command: echo %SystemRoot%
Next, go to the disk with the installed operating system by entering the device letters, followed by a colon. Using the cd command, go to the root directory. Now, using the attrib command, remove the "hidden", "read-only" and "system" attributes from the boot.ini file. Use the copy command to create a backup copy, and then set the attributes in place.
To display the current list of boot options, use the bootcfg /query command. Look through the list and determine the element on the basis of which new settings will be created with the ability to debug in kernel mode. The boot entry ID should be remembered.
Use the bootcfg/copy command to create a boot entry. To specify the identifier of the record that you will copy, use the /id parameter. Using the /d option, specify the name of the entry that will be displayed. Now you need to go back to the list of boot options using the bootcfg /query command, and look at the ID of the added entry.
Now you need to enable options for launching the kernel debugger in the previously created boot entry. If you will be debugging on the target machine, you just need to add the /debug option.
If you want to perform remote debugging by connecting the target computer via a com port to the host machine, then use the /port and /baud options to specify the port number and baud rate.
If you will be performing remote debugging via a FireWire cable (IEEE 1394 interface), then use the /dbg1394 option to enable the corresponding mode and the /ch option to specify the channel number.
To ensure that the changes have been made, check your boot files using the bootcfg command with the /query parameter. After executing the exit command, close the shell window.
Change boot options if necessary operating system. Open the Control Panel through the Start menu, and in it open the System item. In the “System Properties” window that opens, select the “Advanced” tab. In this tab, select the section called “Boot and Recovery” and click on the “Options” button. In the “Boot and Recovery” window that appears, you need to activate the “Display list of operating systems” option. Close both dialog boxes"OK" button.
Restart your computer. Select boot with debugger. Log in and start working on the target machine or start debugging remotely. Use tools such as WinDbg and KD.
Sometimes I have a situation where Windows is waiting for loading time for the kernel debugger. You see the text "Windows start" but not the logo.
If I attach the debugger now, the Windows 7 logo animation plays. After that, the logo starts pulsing. At this point, the download process no longer progresses. CPU load is reduced to a minimum. I usually wait a few minutes, but nothing happens.
This doesn't always happen. However, if this happens, resetting the VM will not help. To fix this problem I need to use startup repair. Unfortunately, this takes forever.
Any ideas what I can do besides running startup repair?
Thank you in advance!
32 answers
To fix the problem you are facing, simply press F10 during boot. And remove/debug and related parameters. Then press enter.
Suggestion: Do not use /debug for the default boot menu option. Copy the boot configuration to a new entry. Then set it to debug mode. Windows doesn't know when you'll use the debugger. Therefore he must wait.
A debugger is the second thing after a compiler needed to create programs. However, many of those who write computer programs and use a debugger are not aware of the principles and mechanisms of its operation.
It's hard to be a debugger...
In light of the fact that programmers use the debugger day and night, especially when they enter deep debugging mode, it is worth saying that if the debugger were not a program, but a piece of hardware, it would probably overheat and break. Because even the compiler doesn’t have as much work as the debugger gets.
Of course, since there are now many different programming languages, there are different debuggers for each of them. And, naturally, for different categories of these languages there are differences in the work of debuggers: for example, a debugger for programs in interpreted Ruby will work differently than for one compiled into bytecode Java language, and the debugger for Java, in turn, will have differences from the Visual C++ debugger.
I'll talk about debugging for the Windows platform. Having understood the principles of operation of debuggers for it, it will be possible to understand both debuggers for POSIX systems and debuggers that work not at the operating system level, but at the level of a virtual machine or some interpreter.
Debuggers for Windows: two types
There are two fundamentally different types of debuggers for Windows. I think everyone came across the first one when programming in Delphi (didn’t program in it? It’s hard to believe. What did you program in at school and in junior college?). These are custom application debuggers. There are many of them, and they exist both individually and (especially, by the way, often) as part of integrated application development environments. Among debuggers distributed as separate software products, OllyDbg is traditionally highlighted, and I once wrote about it in Computer News.
The second type of debugger is the operating system kernel debugger. They are found and used less frequently and their design differs significantly from custom application debuggers. The most famous, and at the same time, the best kernel debugger is SoftIce. Perhaps you have not only heard about it, but even used it.
Since the work of each of the two types of debuggers has its own specifics, I will talk about each of them in more detail.
Custom Application Debugger
The debugger for user applications is simpler, since the operating system takes on the most menial and dirty work. Windows has special software interfaces that are designed for debugging user-level applications - they are called Windows Debugging API. It is the debugging APIs that are used by all debuggers that are built into popular integrated development environments for Windows.
In order for debugging to begin, the debugger must launch the process being debugged in a special way - so that the system knows that this process will be under debugging. After this, the debugging cycle begins: the program is executed until a certain event occurs, which is called a debug event. This runs the debugging loop in a separate thread to prevent the debugger from hanging.
But this is just the beginning. Because the fun of the debugger begins when the debugging event occurs. After all, what is the job of a debugger? To help the programmer localize an error with precision to a specific function, a specific operation, a specific variable. The operating system can also help the debugger in this difficult task.
So, a debugging event has occurred, and then we need to somehow find out how this is related to the program text. This is only possible if the program itself includes special debugging information - a table of debugging symbols. It contains information about the correspondence between addresses and names of functions, data types, and line numbers of code. It is thanks to them that the debugging that every Windows programmer is familiar with is possible. Symbol tables have different formats, and therefore it is not always possible to debug a program compiled by one developer's compiler using a debugger from another manufacturer. But, however, the most common format can still be specified - this is PDB (Program Database), and it was developed, naturally, by Microsoft Corporation.
So, if the debug symbol table is in PDB format, then you can use a special tool from Microsoft - the symbolic debug processor. Once upon a time it was part of the system core and was called Imagehlp.dll, but a long time ago it was separated into a separate library. The character processor allows you to find the nearest open function or global variable at a given address, as well as the line number and name of the source file in which this line is located. Inverse operations are also supported, for example, searching for the address of a function by its name.
This, of course, is not all the work that the custom application debugger does. For example, when debugging multi-threaded applications, many very subtle issues arise related to the interaction of threads. Even when debugging such relatively simple things as services, there are some nuances.
But we won’t dwell on the nuances now - at the end of the article I will tell you where to read about them. Now let's look at kernel debuggers.
Kernel Debugger
Kernel debuggers are much more complex programs than user application debuggers, and I think it's quite clear why: they do not have an operating system assistant. In this case, she is their client, because it is she who, ultimately, must debug.
Most kernel debuggers require two computers connected by a null modem cable to operate. A null modem is a way to connect two computers directly with a cable through their COM or LTP ports. A second computer is needed because the part of the debugger sitting on the first one (on the one where the system being debugged is installed) has limited access to the hardware, and therefore all data output goes via a null modem to the second computer.
Modern Intel x86 architecture processors have special debugging registers (both the old 368 and newer processor models have only eight of them, they are called DR0-DR7). These registers allow the debugger to set breakpoints on memory reads and writes, as well as on I/O ports. In general, everything looks exactly like this, and I don’t think it’s worth describing in detail now what each of the debug registers is responsible for, what interrupts implement breakpoints, and give other similar information. It’s better to tell you about specific existing kernel debuggers for Windows.
Well, firstly, it is a debugger built into the operating system kernel itself. It is present in all NT line operating systems, starting with Windows 2000. It is part of the NTOSKRNL.EXE file, and can be enabled by setting the "/Debug" option for the operating system in BOOT.INI. This debugger requires a null modem connection and a second computer with the same OS.
There is another kernel debugger from Microsoft - WinDBG. Strictly speaking, this is not a kernel debugger, but a hybrid debugger that can also be used to debug user-level applications. It, unlike the debugger built into the kernel, has a graphical shell, and therefore is easier to use. This debugger also supports special extensions that can be useful for some debugging tasks. But it also requires two computers to debug the kernel.
However, there is a kernel debugger that can debug on a single computer. This is SoftIce. At the same time, SoftIce can also debug application programs. The use of this debugger for user programs is justified, for example, in the case of debugging real-time systems tied to the system timer. If you debug using a regular debugger, the result may be incorrect even if the program is running correctly, and SoftIce will stop both the program and the timer. This is useful when debugging multi-threaded applications. In addition, SoftIce has very, very well-developed means of displaying information about all threads in the system, about thread synchronization for multi-threaded applications, information about handles... The only disadvantage of this debugger is its complexity for an application programmer. But of the kernel debuggers this is the simplest and most effective.
For the most curious
Now, of course, talking about debuggers for Windows applications is not as relevant as it was ten years ago. The whole world became interested in the Internet, and the main users of SoftIce were crackers, tireless workers in the field of piracy. However, it's not that bad. Communication with SoftIce undoubtedly develops a person in terms of computer knowledge, although, of course, if you communicate only with debuggers and not communicate with real people, some side effects are possible. Well, I think everyone already guesses about this.
Debuggers are some of the most distinctive types of software, but in terms of development, even user-level program debuggers are quite complex. But, nevertheless, if you have the desire and time to develop your own debugger, your knowledge in the field of operating systems and programming will increase significantly, which means your chances of getting a well-paid job will increase.
So, if you want to create your own debugger, you should first read the materials on this topic. In my opinion, the best book to start with is John Robbins's book, Debugging Windows Applications. It is already old, published in 2001, but the information contained in it is still relevant today, since it is of a general, even in some way fundamental, nature. This book contains examples of writing debuggers for Windows, and it will also be useful if you program in C++ and want to better understand exception handling. Actually, it was from this book that I learned the information about debuggers presented in the article. If you can’t find this book (after all, it’s already quite old), there are several addresses that may be useful to you. The first one is like this: www.xakep.ru/post/19158/default.asp. This article from Hacker magazine goes into a little more detail about kernel debuggers than I did, and also contains code for a simple debugger. And at kalashnikoff.ru/Assembler/issues/016.htm you can learn how to write a DOS debugger. But, of course, it is best to read MSDN and at the same time find some open source debugger to understand it. And, of course, if you have taken up writing a debugger, then success to you in this difficult task!
The term "kernel debugging" means studying internal structure kernel data and/or step-by-step tracing of functions in the kernel. This debugging is a very useful way to explore internal device Windows because it allows you to view internal system information that is not available through any other means, and gives a clear picture of the progress of code in the kernel.
Before you consider various ways kernel debugging, let's explore the set of files that will be needed to perform any kind of such debugging.
Symbols for kernel debugging
Symbol files contain the names of functions and variables, as well as the design and format of data structures. They are generated by the linker program and are used by debuggers to reference these names and to display them during a debugging session. This information is usually not stored in binary code because it is not needed when the code is executed. This means that without it, the binary code is smaller and runs faster. But this also means that when debugging, you need to ensure that the debugger has access to the symbol files associated with the binary images referenced during the debugging session.
To use any kernel mode debugging tool to examine the internals of a data structure Windows kernels(list of processes, thread blocks, list of loaded drivers, memory usage information, etc.) you need correct files symbols and, at a minimum, the symbol file for the kernel binary image - Ntoskrnl.exe. Symbol table files must match the version of the binary image from which they were extracted. For example, if installed Windows package Service Pack or some kind of patch that updates the kernel, you need to get the symbol files updated accordingly.
Download and install symbols for various Windows versions It’s not difficult, but it’s not always possible to update symbols for corrections. The easiest way to obtain the required version of symbols for debugging is to contact the Microsoft symbol server specially designed for this purpose, using the special syntax for the symbol path specified in the debugger. For example, the following symbol path causes the debugging tools to download the symbols from an online symbol server and store a local copy in c:\symbols:srv*c:\symbols*http://msdl.microsoft.com/download/symbols
Detailed instructions for using the symbol server can be found in the debugging tools help file or online at http://msdn.microsoft.com/en-us/windows/hardware/gg462988.aspx.