We all know that overheating the main components of a computer is very dangerous and can ultimately lead to their failure. But how do you know how hot your processor or video card is? For those who are now thinking about measuring the temperature of a computer using a thermometer, I advise you not to rush, since there are much more reliable methods for measuring the temperature of the components of your PC. Today we will talk about a wonderful utility called Aida64, which allows you not only to find out the temperature of your computer, but also to carry out a complete diagnosis of it. We will also learn what to do if it suddenly turns out that our computer is getting very hot.
Signs your computer is overheating
Computer overheating is accompanied by some alarming symptoms that an attentive user should definitely pay attention to. It is worth diagnosing your computer for overheating if:
Taking the temperature
First, we need the Aida64 program itself. It's shareware trial period valid for 30 days, this is quite enough for us. We install the program, run it and see this window:

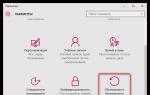
Opening a thread Computer and go to the section Sensors.

Here we can see the temperature of our motherboard (motherboard), processor (CPU), southbridge chipset (MCP), GPU video cards (GPU diode), and in full version programs - also temperature hard drive.
In general, Aida64 can be useful not only for temperature diagnostics. This program can be very useful if you want to buy, for example, new processor, but at the same time forgot the model of your motherboard.
Okay, we have found out the temperature of the components of our system, but how can we now determine which temperature is within normal limits and which is a serious cause for concern? After all, different parts of the computer heat up differently, and their acceptable temperature also differs. Below are approximate figures for individual PC components that you can use as a guide.
CPU temperature
Average indicators normal temperature When the processor is idle, it is considered to be 30-45 degrees, and under good load – 45-55 degrees. When the processor temperature is more than 60 degrees, problems usually begin. The main problem with a processor associated with moderate overheating is the so-called throttling, in which the processor, in order to reduce its temperature, begins to work several times weaker, while skipping cycles. If the processor overheats very strongly, it can completely fail, which, however, is true for any computer component.
Motherboard temperature
Normal motherboard temperature ranges from 25-45 degrees. In general, cases of motherboard overheating are quite rare; you should worry more about the processor and video card.
Video card temperature
Modern video cards heat up quite decently, and if for older models a temperature of 50-60 degrees could be fatal, then in some modern video cards this temperature is a normal indicator (under load, of course). But if your video card heats up to 75-85 degrees, then all is clearly not well with it.
Southbridge chipset temperature
The south bridge, designated in the program as MCP, heats up the most: even when the computer is idle, its temperature is 50-60 degrees. When the computer is under load, the acceptable temperature for the south bridge is 60-80 degrees.
Hard drive temperature
Normal temperature for hard drives is within 30-40 degrees.
How to deal with overheating
If you suddenly discover that any of your computer components (or even several) are overheating, do not rush to panic. Overheating does not always mean that the part has failed. One of the main causes of overheating is dust - fans clogged with dust do not cool and ventilate the system unit well enough, as a result of which the temperature inside the latter rises sharply.

Therefore, the first thing you need to do when your computer overheats is to clean it from dust, paying special attention to the fans and radiators, including the power supply fan. When cleaning the processor heatsink, it would be a good idea to change the thermal paste on the processor (remove the dried old one and apply a very thin layer of new one).

If a total purge system unit dust did not give the desired result, you can try installing more powerful cooling, for example, changing the cooler on the processor and adding a couple of additional fans to the case. When this doesn’t help, it means it’s time to take your computer to a specialist, since you can do it at home full diagnostics system components and you are unlikely to be able to fix the problem.
We also provide computer maintenance services.
In addition, we repair tablets. Our company's technicians will repair your device in a timely manner.
Still have questions? - We will answer them for FREE
The task of monitoring critical hardware operating parameters is especially often faced by overclockers. It is clear that the ultimate goal of any overclocking is to achieve the highest system performance by increasing the speed of individual components.
Side effects of overclocking
Usually the processor, system memory and video card are overclocked. To obtain a higher clock frequency of the device, it is necessary to program the registers of the internal and external clock generators; Often you also have to make changes to the operating mode - add wait cycles and delays, otherwise the device will not operate at an increased frequency. All these manipulations are performed by means BIOS Setup- almost all boards have appropriate settings. Or resort to the help of various overclocking utilities, which today are produced not only by independent developers, but also by the manufacturers of motherboards and video cards themselves.
IN Lately a technique is actively used that allows one to improve the frequency characteristics of transistors included in microcircuits, and thereby increase the overclocking potential of the device. It is known from theory that the switching time of the transistor will decrease if the supply voltage is increased. Therefore, motherboard manufacturers have long included the ability to program VRM stabilizers, which are responsible for supplying power to board components, in the list of required options BIOS settings. And if previously the user could only adjust the supply voltage of the processor core, today he has access to the voltages of almost all important components - memory, north and south bridges of the chipset, processor bus driver circuits, memory, internal bus between chipset bridges, etc. Thanks to this overclocking, almost all system buses can be overclocked, which significantly expands the field for experiments with overclocking.
And even if there are no such settings (for example, the BIOS of video cards usually does not allow such manipulations, although there have already been successful experiments in this area), an experienced overclocker will always find a way to increase the voltage - for example, by resoldering the board (the so-called “voltmod”) .
However, an increase in frequencies never leaves its mark on system components. It is known that the power consumption of the microcircuit directly depends on the frequency. It also depends on the supply voltage. Therefore, by overclocking components, the overclocker obviously worsens the operating parameters of the components - increases their temperature and power consumption, often several times. High temperature negatively affects the operating parameters of microcircuits; overheating can in some cases lead to device failure. The use of effective cooling means during overclocking is strictly necessary.
Another negative effect occurs due to a sharp increase in system power consumption during overclocking. The computer's power supply may not be able to cope with stabilizing currents and voltages, which is why many critical parameters for operation begin to “float away”. This is not only fraught with loss of stability, but also increased heating or malfunctions of other devices - hard drive, optical drive, video card, etc.
Monitoring hardware
Being aware of critical system parameters - temperatures and voltages - is necessary not only when selecting overclocking parameters, but also in the future, when monitoring the operation of devices under stress conditions. It would be too expensive to purchase special measuring equipment for these purposes. Moreover, motherboard manufacturers have long realized the need to integrate simple and effective means of monitoring voltages and temperatures into their products.
In addition to monitoring, these tools are well suited for protecting the system from failures and damage in emergency situations. In particular, the monitoring system will warn you about processor and system overheating, fan stoppage, power supply failure, and also cause a forced system shutdown or slowdown.
Monitoring tools were initially implemented using a special monitoring chip and external temperature sensors - thermistors, thermal diodes, etc. The monitoring chip contained a number of ADCs, the inputs of which were supplied with supply voltages and signals from temperature sensors and fan tachometers. Programmatic access access to the chip was carried out via the ISA/LPC or SMBus bus, and both BIOS functions and software utilities could use its services. Subsequently, the monitoring functions were integrated into other system components, for example, into the south bridges of the chipset or input-output bridges (“Super I/O”, chips supporting old ports - LPT, COM, PS/2, FDD). Some motherboard manufacturers use their own monitoring chips, which differ in the implementation of some specific functions.
Temperature measurement sensors have appeared in all modern processors and graphics accelerators, which makes it possible to measure their temperature more accurately. In addition, processors have received means of automatically monitoring their temperature, so the need to protect them from overheating is not so relevant today.
In addition to the actual tracking, today's monitoring schemes have temperature controls. In particular, they are able to adjust the fan speed depending on the current temperature. This is done by modulating the supply voltage supplied to the fan impeller motor using the PWM method.
There are also coolers that can receive control signals from the monitoring chip and control their rotation independently. Monitoring chips, however, so far only specialized ones, “are able” to regulate the frequency of the processor, monitoring its load by temperature or current consumption.
Choosing a utility
It’s good when the hardware implementation of monitoring has such advanced management capabilities. But often monitoring performs only a passive function, providing information upon request and not taking any active action. In this case, the hardware must be supplemented with software.
Today, almost every motherboard manufacturer offers its own set of utilities for monitoring and configuring the system. You can, of course, limit yourself to this option. However, it should be kept in mind that such utilities often have many disadvantages. This is the interface: often multi-colored and tasteless, with a very peculiar arrangement of controls, a minimum of settings and inconvenient display and logging tools. This is also functionality: support for only a limited number of boards (your board may not be supported - and this happens), without the ability to configure and test operation. Stability and support for various operating systems can also be poor, and regular version updates are often out of the question.
At the same time, for monitoring utilities, manual configuration tools are extremely important for successful operation. The fact is that the monitoring chip or the corresponding functions of the south bridge of the chipset are just a set of contacts and a means of accessing them. The motherboard designer has complete freedom in choosing what and how to connect to these pins. The order of connecting voltages, fans, types of sensors - everything remains on his conscience. Of the three available contacts for temperature sensors, it can connect all or only one; it can connect two sensors from the processor at once - built-in and external, and in any order. The utility can only guess what is connected to the chip. The user must check all the readings himself and select those settings that give the most plausible results. The board manufacturer never reports the layout of the monitoring system. The only alternative to such manual configuration is a database of all boards. In "branded" utilities such a database is most often available.
But in other respects, third-party utilities are usually better than proprietary ones. Their authors constantly monitor the emergence of new chipsets and monitoring chips and make the necessary changes to ensure support for all possible options. While expanding functionality, they make sure that their programs are compact in size and fast, otherwise users will quickly switch to competing programs. Often, developers support each other - developing plugins, integration and management tools, and ensuring program compatibility. However, many truly successful monitoring programs are completely free and freely available for download.
SpeedFan is a good option for monitoring utility
For a long time, Motherboard Monitoring (MBM) remained the most popular and widespread monitoring program. Despite the somewhat "heaviness" of the interface, it provided convenient means of setting up access parameters for microcircuits, different ways of displaying results and logging. And the main feature of this utility was the presence of an extensive database of boards. MBM still remains well-known and popular; it is supported in various system utilities for other purposes.
However, it’s already been a year since the author of MBM, Alexander Van Kaam, stopped supporting his successful development, which he officially notified users through his website (mbm.livewiredev.com). The program is still usable, but it may not support new motherboards, since the list of chipsets (the implementation of the SMBus bus varies from chipset to chipset) and microcircuits with monitoring support must be constantly updated.
Among free alternatives MBM There are several even more powerful monitoring programs, the most popular of which is SpeedFan. This is a utility by Italian developer Alfredo Milani Comparetti, the official website is located at www.almico.com/speedfan.php. The program not only has extensive capabilities for monitoring system parameters, but also allows you to overclock the system (the list of boards is limited), control fans, obtain information about memory and perform a number of related functions.
More about SpeedFan
Let's list the main features of this wonderful utility:
- support for reading parameters using dozens of popular monitoring chips (National, Analog Devices, Philips, Fintek) and microcircuits that have the appropriate capabilities (Winbond, ITE, VIA, NVIDIA, SIS);
- support for chipsets from various manufacturers - Intel, AMD, SIS, VIA, ULi, ATI, NVIDIA and even ServerWorks;
- support for reading hard drive temperature via the SMART mechanism;
- support for reading graphics chip temperature (only for NVIDIA GeForce older series);
- automatic and manual (by control points) control of fan rotation (not for all monitoring chips);
- control point control of the processor bus frequency (only for a few motherboards equipped with ICS clock generators);
- displaying SMART attributes of the hard drive;
- displaying temperatures and other parameters in the system tray, logging;
- displaying a graph of parameter changes;
- setting the reaction to events (changes in temperatures and other parameters) - sound signal, message, launching programs;
- support for 64-bit operating systems of the Windows family;
- multilingual interface, Russian support.
Unfortunately, SpeedFan must be installed. In this case, a system driver is added to the system, with the help of which SpeedFan gains access to the I/O ports. It is known that this is the only way to work with ports, but many system utilities launch the driver automatically, without requiring prior installation.
SpeedFan's interface is simple and unpretentious. The program has a single window in which the program start log is displayed (it could have been hidden), data on fans, temperatures and voltages, the load level of the processor (or several processors), two buttons - for minimizing (to tray) and calling up settings. Using bookmarks, you can switch to other modes (however, you don’t have to access them): clock generator programming (works for several boards), access to devices on the SMBus bus (of interest only to developers), SMART, graphics (no settings at all).
The settings window is not organized intuitively, so you can figure out what's what only using the help file. You should start setting up with the "Advanced" tab, where you can configure the parameters for interpreting data from the monitoring chip. Next, you should configure the outputs for controlling the fan speed ("Speeds"), then give names and specify the thresholds (desired and limit) of the temperature measurement inputs ("Temperatures"), check the data on the fans ("Fans") and voltages ("Voltages") . You can also configure event triggers ("Events"), enable the log ("Log") and change a few interface parameters ("Options").
Perhaps, excessive complexity, an obscure interface and the need to study documentation to configure are serious disadvantages of SpeedFan, so this program cannot be recommended to inexperienced users. On the other hand, SpeedFan supports a variety of chips and allows you to accurately configure them, which makes this utility an indispensable tool in the hands of an overclocker. If you understand the settings, you can provide flexible fan control and warnings when parameters go beyond specified thresholds. But perhaps the most useful use of SpeedFan is monitoring critical system parameters when overclocking, organizing a “quiet” PC, or other experiments.
P.S. You should always remember that hardware monitoring data is for reference only; you can only use them as a guide when selecting overclocking parameters, but do not take them as exact numbers. This is due to errors in measurements, flaws in the board layout, and losses on the way from the source to the monitoring chip. And the correct parameters for reading data cannot always be guessed, even with such a powerful utility as SpeedFan at hand.
Max KURMAZ,
[email protected]
,
HW.by
- Belarusian "iron" site
In this article, I offer an overview of such programs, tell you about their capabilities, what exact temperatures of your PC or laptop you can use them to see (however, this set also depends on the availability of temperature sensors for components) and additional features these programs. The main criteria by which programs were selected for review: shows necessary information, free, does not require installation (portable). Therefore, please do not ask why AIDA64 is not on the list.
I have already written more than once about the Speccy program (from the creators of CCleaner and Recuva) for viewing the characteristics of a computer, including the temperature of its components - it is quite popular. Speccy is available as an installer or portable versions, which does not need to be installed.
In addition to information about the components themselves, the program also shows their temperature; on my computer the following were displayed: the temperature of the processor, motherboard, video card, hard drive and SSD. As I wrote above, the temperature display depends, among other things, on the presence of appropriate sensors.

Despite the fact that there is less information about the temperature than in the previous program described, it will be quite enough to track the temperature of the computer. Data in Speccy is updated in real time. One of the advantages for users is the presence of a Russian interface language.
You can download the program from the official website http://www.piriform.com/speccy
CPUID HWMonitor
Another one simple program, which provides comprehensive information about the temperatures of your computer components - HWMonitor. In many ways it is similar to Open Hardware Monitor, and is available as an installer and zip archive.

List of displayed computer temperatures:
- Motherboard temperatures (south and north bridges, etc., according to sensors)
- Temperature of the processor and individual cores
- Video card temperature
- Temperature hard HDDs And solid state drives SSD
In addition to these parameters, you can view the voltages on various PC components, as well as the rotation speed of the cooling system fans.
You can download CPUID HWMonitor from official page http://www.cpuid.com/softwares/hwmonitor.html
OCCT
Free OCCT program is intended for system stability tests, supports the Russian language and allows you to view only the temperature of the processor and its cores (if we talk only about temperatures, otherwise the list of available information is wider).

In addition to the minimum and maximum temperature values, you can see it displayed on a graph, which can be convenient for many tasks. Also, using OCCT, you can perform stability tests on the processor, video card, and power supply.
The program is available for download on the official website http://www.ocbase.com/index.php/download
HWInfo

Well, if all of the listed utilities were not enough for some of you, I suggest one more - HWiNFO (available in two separate versions 32 and 64 bits). First of all, the program is designed to view the characteristics of the computer, information about components, BIOS version, Windows and drivers. But if you click the Sensors button in the main program window, a list of all sensors in your system will open, and you can see all the available computer temperatures.

In addition, voltages, S.M.A.R.T. self-diagnosis information are displayed. for hard drives and SSDs and a huge list of additional parameters, maximum and minimum values. It is possible to record changes in indicators in a log if necessary.
Finally
I think the programs described in this review will be sufficient for most tasks that require information about computer temperatures that you may encounter. You can also view information from temperature sensors in the BIOS, however, this method is not always suitable, since the processor, video card and HDD are idle and the displayed values are significantly lower than the actual temperature when working on the computer.
Sometimes situations arise when your computer stops working and you have to take it to service center. In some cases, you can hear that the South Bridge is faulty and the entire motherboard needs to be replaced. The diagnosis seems to be clear, but not every user knows the concepts of South Bridge and North Bridge. These two computer devices, or rather the motherboard, are the main functional controllers responsible for the operation of all other components of the motherboard. Together, these bridges form a chipset, but still each of them is responsible for its own functions. These square-shaped chips received such an unusual name due to their location on mother card: North is at the top under the processor, and South is at the bottom.
North Bridge
The north bridge is a control device that is responsible for the interaction of the motherboard with your computer's RAM, video card and processor. In addition, this chipset element not only interacts, but also controls the speed of operation of the components described above. One of the parts of the Northbridge is the built-in video adapter found in some modern motherboards - the so-called integrated video card. Accordingly, this bridge additionally controls the bus of the device responsible for transmitting the image to the monitor and its speed. Additionally, the North Bridge connects all mentioned devices to the South Bridge. As a rule, this chip has its own passive cooling, that is, a radiator is installed; it is less common to see active cooling using a cooler. This is done because the temperature of the North Bridge is about 30 degrees higher than the temperature of its South Bridge. This is due to the processing of commands from the most active components of the system and the close proximity to the processor, due to which heating occurs from the outside.
South Bridge
The South Bridge is a functional controller, the main function of which is to implement the so-called “slow” connections, which include various buses, USB, SATA and LAN controllers, power supply system, BIOS and even the clock, in general, the list is quite large. That is why the failure of the South Bridge leads to the need to replace the entire motherboard. Considering that this controller interacts directly with external devices, the cause of the breakdown may be ordinary overheating, triggered, for example, by a short circuit.
One of frequent breakdowns modern computers is the failure of the south bridge. If it gets hot south bridge in standby mode, one or all failed USB ports- these are the main symptoms of its failure. Today we will show quick way how to check the southbridge for motherboard.


Check the F_ USB1 connector.


Let's check F_ USB2.


diodnik.com
How to check if the Intel South Bridge has burned out?
 Fig.1 USB Data pins
 On the vast majority of Gigabyte motherboards, when standby power is supplied, the south bridge begins to heat up within 5-30 seconds. If in standby mode the bridge is cold, but immediately after switching on it starts to get very hot, this indicates a malfunction of the 1.5V bridge power driver. For ASUS boards This is a cascade stabilizer made on two field effect transistors(3.3--->2.4--->1.5), and on Gigabyte boards there are one or two transistors connected in parallel (simple boards have 3.3--->1.5, more sophisticated ones have 2, 5--->1.5, with 2.5 V generated by a PWM converter). In most cases, the bridge itself remains alive.
In the simplest case, with a faulty south bridge, the POST indicator shows code 25 for Award BIOS and D0-D4 or DD for AMI BIOS.
In 99% of cases, one or more USB Data pins are shorted to ground, which can be easily checked by ringing them. In the photo, all the USB Data pins for the Gigabyte 8IPE1000 rev.3.1 board that need to be ringed are circled in red.
The most difficult cases to diagnose are when USB Data does not short to ground, the standby voltages are not drained, and the bridge does not get hot even after the board is started. But there were only two such cases in my practice and this is rather an exception, but we came to the conclusion that the bridge was faulty (a replacement confirmed this) after replacing the cartoon, soldering the socket and flashing the BIOS firmware.
According to our statistics, in 60% of cases the Chinese DATA cable for cell phones. Another 30% comes from USB Flash Drive and 10% on others USB devices. However, there were cases when USB devices were not used on the board, but the bridge burned out on its own! For prevention, when actively using cellular DATA cables, it is recommended to install an additional PCI-USB controller.
www.rom.by
How to check the south bridge?
One of the common breakdowns of modern computers is the failure of the south bridge. If the south bridge heats up in standby mode, one or all USB ports have failed - these are the main symptoms of its failure. Today we will show you a quick way to check the southbridge on your motherboard.
In most cases, for preliminary diagnostics it is enough to check whether the USB Data pins are shorted to ground of the motherboard. For clarity, we will show on the Gigabyte G31M-ES2C motherboard how to perform such a simple check. We just need a regular multimeter.
To do this, you need to put the multimeter in dialing mode and check the Data pins of each one in turn. USB port.
You need to check not only the ports that go to back panel, but also the connectors to which USB is connected from the front panel, so we’ll start with them. For convenience, below is indicated USB pinout on the motherboard (there are two USB ports in this connector).
We install one multimeter probe on the ground of the motherboard, with the second probe we alternately touch the Data + and Data – contacts of each port. The multimeter readings on different ports should not differ much.
Check the F_ USB1 connector.
As you can see, F_ USB1 has normal readings.
Let's check F_ USB2.
Everything is obvious here, both USB ports on F_ USB2 are shorted to ground.
The conclusion is obvious: the south bridge has failed. Replacing the south bridge is not a cheap thing; it cannot be done at home; in this case, repairing such a motherboard is not advisable.
Why is the south bridge burning down?
There can be a lot of reasons, ranging from banal overheating due to an ill-conceived or incorrectly assembled cooling system, to low-quality Chinese phone cables or flash drives. The culprit may also be a power supply that has failed.
Comments powered by HyperComments
diodnik.com
South and north bridge on the motherboard
A computer motherboard is a technically complex device that deserves close attention. It provides interconnection of all the most important components of any computer, such as the central processor, RAM, video subsystem. The design of any of the motherboards is based on a chipset, which is formed from the north and south bridges. Read on to learn what the north bridge is responsible for on the motherboard, what the south bridge is responsible for, and where they are located.
What is the north bridge responsible for?
First, let's figure it out - what is the north bridge on the motherboard? The North Bridge is a controller that coordinates the operation of the most active and energy-intensive components, such as the processor, RAM and integrated graphics. It is not difficult to guess that the duties assigned to it entail increased heating, as a result of which this controller has its own cooling system. Most often it is of the passive type, but there are also examples with an active cooling system.
Where is the Northbridge located on the motherboard?
If you look at the motherboard, the northbridge is located in the upper half, closer to the central processor. This location was not chosen in vain. Firstly, all the devices that are controlled by this controller are located here. Secondly, active cooling system central processor is also partially involved in its cooling. This technique can be seen with the naked eye where the controller's passive cooling system is present. If you look closely, you will see that this controller is located so that its radiator is in the area where cooled air flows, pumped by the CPU cooler.
What is the south bridge of the motherboard responsible for?
The South Bridge coordinates the so-called “slow operations”, the list of which is impressive. In particular, it controls the energy saving system, system clock, BIOS, IDE, SATA, USB, LAN, Embeded Audio, etc. interfaces. The south controller is located at the bottom of the motherboard and is not equipped with a cooling system. This design feature often causes it to overheat and ultimately cause the entire motherboard to fail.
In a normally functioning computer, the temperature of the south bridge is 30 °C lower than that of its north bridge. Therefore, there is usually no reason to worry. The reasons for its overheating, leading to a fatal outcome, can be different - poor contact of the chip with motherboard, short circuit in the USB connector or static discharge transmitted via the USB interface.
Canal-IT.ru
How to check bridges on the motherboard?
Help me urgently!)) One person told me that the bridges on the motherboard burned out (or on the way to another world). How can you check this with only straight hands), desire and a multimeter? The hardware consists of only 2 power supplies, this same motherboard, 3 video cards (one of them is 100% working, this system was once run on it) and a processor and RAM for it.
By the way, the board is old, it has all sorts of LPT and COM connectors, in addition to USB, so (maybe) you can observe some diagnostic signals on them
- Question asked over a year ago
- 3799 views
- hmm.. well, the north bridge is slots for ddr. memory does not see - the north bridge is out. The north bridge also controls the video card slot. the south bridge rules everything else - pci slots, connectors on the motherboard of all types ide, sata, usb, lan, audio Like 2 2 comments
- What kind of mother? Disconnect all peripherals, video and memory from the motherboard with the exception of the processor, connect the speaker. Check: resistance between RESET and common, USB D+, D- and common. Try placing a piece of eraser under the bridge from the bottom of the motherboard and press the radiator to the board with your hand GENTLY WITHOUT DISRUPTIONS and try turning it on. Does the speaker make sounds? What are the voltages on the processor, memory, etc.? Like 1 Comment
- Samara
- Full time work
- Kaliningrad
- Full time work
- More vacancies