Quite often, users need to save data from 1C 8.3 to a file, for example, pdf, Word, Excel and other formats. For example, send by e-mail report to another person, make calculations in Excel. Unfortunately, not all users know that it is very easy to download such data from 1C on their own without outside help.
It is often necessary to download a list of some data from the tabular part of a document, a list form, a document log, etc. Such tasks are often isolated, and it is inappropriate to involve a specialist to write a report.
For example, you need to get the entire item with the “Materials” view, but you only need the columns “Item” and “Unit”.
In the case when you need to upload data with filtering, first of all, you need to configure the list in the “More” menu of the tabular section.
In the window that appears, from the left side (available fields), you need to select those by which you will make a selection (in this case, “Type of item”). In the right part of the window, the values of the selection parameters are set. Moreover, the type of comparison is not limited to equality alone.

After the stock has been set, in the list form of the “Nomenclature” directory, only those items that meet the specified condition will be displayed.
The next step is to output this list into a spreadsheet document.
From the More menu, select List.

If you need to display not all columns, as in our example, then check the boxes only for those that are necessary.

As a result, you essentially get a report that we can save in any available format. How to do this will be discussed below. In a similar way, you can download tabular parts of documents and reference books, data from document journals, list forms, and more.
Uploading reports and printed forms from 1C
Any report printed form, a spreadsheet document (for example, which we received in our example) in 1C 8.3 can be uploaded to external file in two clicks.
On the top panel of the program there is a button to save to an external file (Taxi interface). It will be active on any reports and printed forms where saving is available.


Uploading the entire 1C database
This method is necessary in cases where the 1C database needs to be unloaded as a whole, for example, to create a test copy.
Go to the desired information base in configurator mode.

In the “Administration” menu, select “Download infobase”.

Specify a different file name and save path if necessary.

The resulting downloaded data file with the *.dt extension is very easy to download in the future. To do this, in the configurator mode, in the “Administration” menu, select “Load infobase” and open the *.dt file received earlier.
Very often you need to obtain data from 1C 8.3 and save the information to an external file, in other words, download it from 1C enterprise. The task is almost always possible without the involvement of 1C programmers.
Consider the series useful tips, with the help of which you can upload data from 1C to an external information system.
In 1C there are several methods by which you can obtain information without the involvement of specialists:
- Uploading the entire database from 1C 8.3 - for subsequent loading on another computer
- Save reports and printables in Excel, Word or PDF
- Uploading tables from 1C
- Retrieving Information Using the Query Console
More details about them:
How to download the entire database from 1C 8.3 (to a .dt file)
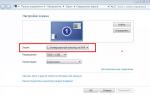
To do this, you will need to go to the configurator mode, then in the main menu select “Administration” - “Upload information base”:
Then you only need to indicate the name of the future file and its location on the disk.
To subsequently upload to another database, click on the “Load information base” button and select the previously uploaded file.
Uploading reports and printed forms from 1C to Excel
This method is universal and very simple. To do this, it is enough to open a printed form or report.
For example, open the TORG 12 printable form, press ctrl+S (or in the File – Save As menu) and select the file type and its name:

The same system applies - the report is downloaded in two clicks:

Get 267 video lessons on 1C for free:
Saving in the main formats is available - excel, word, pdf, html, txt, etc.
Uploading tables from 1C 8.3
Often there are such trivial tasks as “get a list of payments for the current year”, “unload a book of purchases or sales” or “unload goods from invoice No. 256”. Solving such problems is quite simple.
For example, I need to receive all receipts from the counterparty “Vector” with an amount greater than 1000. Let’s open the list form and set the necessary selections in the list:


The system will offer an output option - to a spreadsheet document or a text document, select tabular. The 1C program will display the information in the following spreadsheet document, which, like reports, can be saved in the format we need:

Similar actions can be performed for almost any tabular part in 1C 8.2. For example, we needed to unload a list of goods from receipt No. MSK00003, no problem. This is done very simply - open the document, call context menu and after a couple of clicks we get the desired download in the required format:

Uploading a journal of transactions from 1C to Excel:
Retrieving Information Using the Query Console
However, not all information can be found in the simple tabular part of 1C 8.2. Sometimes you need to collect data from several data sources and connect them using some fields.
This method is suitable for technically savvy people who know the basics of query language. It consists in obtaining the result of the request using and saving it in the format we need.
For example, you need to get all supplier counterparties and their phone number. To do this, we will write the following query:

The resulting table can also be downloaded to required format file:

You can load the received data into another 1C database using “ “. Watch the video instructions using the nomenclature as an example:
Send this article to my email
The procedure for transferring data from 1C (list of elements of a directory or document, tabular section document, etc.) into Excel format is a very convenient 1C function, because allows you to save almost any data in Excel for further analysis.
1c enterprise version 8.2:
For example, we want to download data from the Nomenclature directory; to do this, open the Nomenclature directory, display the necessary data (use selections, open the desired group):


And click OK.


After this you have specified path An Excel file will be created with the necessary data from 1C.
But, you don’t have to save the data to a file, but simply (after displaying the list) select the data, then save it to the clipboard ( right click mouse - Copy), open Excel and paste the data from the clipboard into a blank sheet (right mouse button - Paste).
In the same way, you can save lists of documents and tabular parts in them.
If you want to save the report in Excel, then create a new report, and in order to upload it to Excel, you no longer need to display it in the list, but simply click on main menu“File” - “Save a copy” and then according to the scheme described above. Or simply copy it via the clipboard.
1c enterprise version 8.3:
On the 1C platform version 8.3, the technology for saving data in Excel is slightly different from version 8.2.

Here, if you right-click on the list, you will no longer see the “Display list...” item; instead, you need to click on the “All actions” menu and select the already familiar “Display list...” item:

In the same way, mark with flags required columns, but there is also a wonderful “Only selected” flag; when set, only selected rows are displayed in the table. To select several lines in the list of the nomenclature directory, click on the lines with the mouse while holding down the "Ctrl" key, you will get something like this (selected lines are highlighted in blue):

In the end, it should look something like this:

Next, you can save this table in Excel via the clipboard (as I wrote above), or save it directly to an Excel file. To do this, in 1c (in the displayed list), click on the special main menu button (with the down arrow) and select the item "File" - "Save as...", then a standard file saving window opens, in which you specify the file name and type " Excel sheet" and click "Save".

To save the report to a file, do the same as I wrote just above:
Home 1C:Taxpayer 8Saving and reuse regulated reports
Once generated, regulated reports are stored directly in information base. If, after generating a regulated report, you select the “Save” command on the right side of its form, the report will be saved in the journal of regulated reports.
You can work with the journal of regulated reports as with a regular document journal of the 1C:Enterprise 8 system. The log displays a list of all generated and saved reports, and if the log contains too many reports, then for ease of viewing you can select by type of report and by period.
From the log you can open any previously generated report, you can make changes to it and save it again with the changes already made. Moreover, if the form of a regulated report changes over time, the report will be opened in the corresponding old form.
You can reprint the report from the log, re-upload it to in electronic format. In the journal, you can delete old or incorrectly completed reports.
Saved reports can be used to quickly complete new reports. To generate a regulated report for a new tax period, you can copy the old report and then correct the changed data.
Rating: / 0
Today we will talk about settings in reports in “1C:Enterprise” 8.2 or 8.3, using the example configuration 1C:Enterprise 8. Trade management for Ukraine
Update
We have supplemented the article with settings for configuration on controlled forms and wrote about some tricks for setting up reports in 1C:Enterprise 8. Trade management for Ukraine, ed. 3.1 (managed forms)
Let's look at how using an example configuration Trade management for Ukraine
You can easily and quickly customize the report exactly to your requirements.
Managed forms mean that appearance reports can be customized as you see fit. After all, previously, if a user wanted to change report settings, he had to ask the programmer to “finish” the reports he needed. Now you can customize any report yourself without the help of a programmer.
Report settings in 1C:Enterprise 8. Trade management for Ukraine, ed. 3
To configure the report, click on the button Settings. A window with settings opens in front of us.

To see all (advanced settings), click All actions → All settings

In this window we can add the fields we need, group fields, make selections, and much more.

In the period line – we can choose for which period we want to see data.
Selected fields – here you can add missing fields

On the selection tab we can select only those elements that you need to see.
Types of comparison:
- Equals– You can only select one value
- Not equal- value for which you do not want to see data
- On the list– if you want to select several values
- In a group from the list- you can select a list of several data groups.
- Not on the list- selection of a list of positions that should not be included in the report
- Not in list group– excluding the list of data groups from the selection
- In Group– in this case you will see data for only one group/category
- Not in group- data group exclusion
For example, in a list of goods in warehouses, we want to see all the goods that we have in stock. To do this, set the Final balance selection to greater than 0.

Now our report looks like this:

On the sorting tab we can sort our data.
For example, we want to sort our products alphabetically. To do this, go to the sorting window. And simply drag the “Nomenclature” attribute to right side window and set the sorting direction to “Ascending”.

The report started to look like this:

On the Grouping tab we can group data by some value. For example, we want to see our balances in terms of warehouses. Everything is simple here: we click on the three dots, go to the editing groupings window and add a new “Warehouse” grouping and select the “Hierarchy” type.


We will also group by month, that is, we will find out in which month we received the goods.
To do this, add the following grouping: Period month (it is also possible to group by years, quarters, days)

Now let's look at the appearance of our report:

As you can see, in the settings we have doubled the grouping by warehouses. How can we find out where the extra group came from? Since in managed forms you can design a report yourself, so let’s go into the report structure itself. To do this we go to

We see the structure of the report:

That is, the report is structured as follows: first there is grouping by warehouses, then subgroups: grouping by Nomenclature, characteristics, series and units of measurement, after which there is grouping by movement documents, and the last independent grouping is unit of measurement
If we simply disable the Warehouse checkbox, then 2 groups will be disabled: item and registrar. Therefore, we simply “grab” the Nomenclature line and drag it into the Report. Uncheck warehouse. Now the structure of our report should look like this:

Now the report looks nice:

On the item fields tab, we can select only those fields that we want to see in the report. For example, in the List of goods in warehouses report, we want to see the article number of the item, the name of the item, the characteristics of the item, units. measurements. To do this, go to the Item Fields tab and set all the above listed details. Also, in order for the name of the item and its characteristics to be in one column in the report, it is necessary to place these details in one group (as shown in the figure).

Using the Conditional Appearance tab, we can also make our report in color. For example, we want to quickly find the quantity of a product in a certain warehouse. To do this, highlight a specific warehouse with color:
On the Condition tab, select the warehouse that we want to “paint”. Warehouse = Groceries Store

On the design tab, select which color (choose yellow):

On the Formatted fields tab we can see which fields/columns we will change in color. If we leave this tab empty, the program will fill in yellow everything about the “Products Store” warehouse

Now let’s create our report!
Now it looks like this:

First we see grouping by warehouses, then grouping by month.
You can switch between settings thanks to a button like - Select settings:


Our setting is this moment is available only to us, but if we want to add it to other users, then we need to go to the section Administration → User and rights settings → Copying settings

On the Report Settings tab we see all the reports whose settings we saved, and now we select our setting.
Now all we have to do is copy and close.


There is one more trick with reports on managed forms: you can add columns and rows in a slightly different way.
Let's go through All actions → Change report variant
The following window opened before us:

Here we can also group, sort, add columns/rows. In general, everything your heart desires.
And using the example of the Gross Profit report, I will show how you can add the Markup column.
We also go to settings via All actions → Change report variant.

In the window that appears, write the name of our column: Markup.
In the Expression of total records field, enter the formula: Revenue/Total*100 – 100

On the left we find a folder called Custom Fields and see the newly created Markup
Add it to the right column

Now let’s add our markup to the report structure: Organization and Divisions:

And let's finish editing.
Let's generate a report.

We see that new column appeared, but to put it mildly, we are not satisfied with the number of decimal places. But this is also very easy to fix.
We need to return to the settings, namely to the Custom Fields tab, and edit our formula. The number format we want to see is 2 decimal places.
We make the following formula: Format(Revenue / Total * 100 - 100, “NAV = 2”)

Let's generate the report again.

Now we see that everything is in order!
But it happens that an error pops up: “Division by zero.” To avoid such an error, let's write the formula as follows:
Choice
When Total<> 0
Then Format(Revenue / Total * 100 - 100, “NAV = 2”)
Otherwise 0
End
We can also add a new plate to our report. To do this, we also go to Change report version. Further Add → New Table.

Now let's add rows and columns.
Let's say we want to see gross profit only by segment Appliances.
Let's add the following groupings to the lines: Nomenclature.
On the Selection tab, enable the “Current item has its own selection” checkbox and add items from the household appliances group.
On the Fields tab, also enable the checkbox “The current element has its own settings for the selected fields” - Nomenclature.
In the structure of our table, namely columns, we add a new grouping, leaving the field empty.


Let's call our table: Household Appliances. To do this, go to the Table and on the tab Additional settings Let's enter a title (as shown in the figure below).

Now let's generate a report.

Our new sign was included in the gross profit report.
Everything is elementary!
Report settings in 1C:Enterprise 8. Trade management for Ukraine, ed. 2.3
Reports in 1C:Enterprise are a constructor, but not every user knows about the intricacies of report settings.

We set up reporting, click the Save settings button on the report panel, Create a new one, write the name of the report. If you want this report to open when opened, check the Open column.
To open necessary settings report, click on the Restore settings button, and double click select the desired setting. Don't forget to click the Generate button.
2. How can I customize a more detailed report?
Open the required report, click the Settings button, check the Advanced settings checkbox at the bottom, you will have additional bookmarks.
General tab
Use checkboxes to indicate which columns you need to see in the report and which not.
Use arrows to select the location of the columns.

Groupings Tab
On this tab, you can add/remove those columns/rows that you would like to see in the report, as well as transform the data for easy viewing.
Grouping rows - data will be generated downward, Grouping columns - data will be generated to the side (to the right). For example, in Row Grouping you can view sales data by item, and in Column Grouping you can see these sales by month.
You can add any field to fill in data in the report. Click the Add button, the Select Field window appears, where there are all the options that can be added to the report. We select the required option (with the plus sign you can reveal more information, for example, you need to look at the data in the context of the product article, then you click on the product and everything that relates to the product expands). Click OK to add a new field.

Row/column grouping type is an option for viewing data (grouping), for example Hierarchy, allows you to collapse/expand results.
3. How can I make a selection in a report based on a specific element of a directory/document/group of directories?
Tab Selection allows you to make a selection not only by those rows/columns that are already in the report settings, but also to add your own Selection option.
To do this, click the Add button and add the option you need from the Field Selection window. By ticking we make a choice for which element we will have a selection. Thanks to the Comparison Type column, we can choose not only separate element, but also groups.
Comparison type
Equals- select only one position
Not equal- one position for which you do not want to see data
On the list- the ability to create a list of positions that you want to see in the report. Through the List Selection window, create the required list of directory/document elements.
In a group from the list- you can select a list of individual groups/subgroups. In order to select exactly the group folder, you need to click the Select button, and so make a list of those subgroups for which you would like to see selection.

Not on the list - selecting a list of positions that should not be included in the report
Not in list group- selecting a list of groups/subgroups that should not be included in the report

In Group- you can select only ONE group (to select a group you must click the Select button)
Not in group- selection for one group that should not be included in the report.
4. How to create additional fields in separate columns?
Additional fields tab allows you to create additional fields in a separate column
- Add the required field
- Select Placement, in a separate column or in one column that is already in the report
- Select Position, before the Grouping column (that is, the first column), after the Grouping (second column), or instead of Ggrouping (that is, there will be no Grouping column at all).

5. How to sort a field in a report in ascending/descending order?
For example, we need to display product sales statistics; at the beginning of the report we will have the best-selling product.
Tab Sorting
Select the field that needs to be sorted - this will be the Quantity field (in base units), select the Descending sort option. And first we look at the best-selling product. If you need to look at a poorly selling product, then select sorting by Ascending.
6. How to remove zeros after the decimal point from a quantity in a report
Tab Design
Select the Quantity in basic units area in the column, open the Design column, check the box next to the Format field and open the value.
Next to the Length field, put a checkmark and select the maximum length of your number. If you need to set the fractional separator (that is, how many digits should be after the zeros), then check the box and select the number of decimal places. If you don't need fractional parts, then don't change anything.

We press the OK button, this setting goes to the Edit Design Settings window, we also click OK there, and now this format setting is included in the Design Tab.
We generate a report, and our quantity is now without a fractional part.

* Using the Design tab, you can select different design options. In another lesson we will provide options for setting up the report design.
7. Duplicate report settings for other users.
For example, we have managers who need to save the same Sales report in their settings. There are 7 of these managers, and the report settings are serious, and duplicating this seven times for each user is completely troublesome.
There is a way out!
- First, let's set up this report for one manager and save it.
- Then we go to the second manager’s database, open the Sales Report, click on the Restore settings button, this list is empty (since the second manager did not have saved settings).
- Click on the Settings all users button at the top, and now this list contains all the reports that were saved by users.
- Select the desired report, click Generate, and we have the report that we configured for the first manager
- Now we click the Save button and the settings of this report are saved for the second manager.

Today we told you just a few tricks for generating reports in 1C:Enterprise, of course these are not all the secrets, look for the rest in our next lessons.
We hope this lesson was useful to you! Thank you for your attention!
Best regards, company Fin Soft
You can learn this from us in the online courses “1C:Enterprise”, or enroll in our courses “1C:Enterprise”, which take place in our office.
If you have not purchased this program yet, you have an excellent opportunity to buy 1C:Enterprise 8. Trade Management for Ukraine on our website Below we have collected similar topics for you that will help you understand the functionality of the 1C:Enterprise program.
- < Назад
- Forward >
Secrets of setting up reports in 1C:Enterprise 8.3 - 4.5 out of 5 based on 6 reviews